PWN Abundance - HESS J1718-385
June 2007
Pulsar wind nebulae - PWNe - are amongst the most abundant sources of very high energy gamma rays in our Galaxy. Rotational energy of the neutron star is converted - by some not fully understood mechanism - into a relativistic stream of particles, presumably mostly electrons and positrons generated near the pulsar. This pulsar wind terminates in a shock when it encounters the ambient medium, which is often composed of ejecta from the supernova explosion which created the pulsar. From the termination shock, electrons emerge with the power-law energy distribution typical for shock-wave acceleration and stream or diffuse away from the shock. The electrons in the resulting pulsar wind nebula form an efficient source of high energy gamma rays, by upscattering of ambient photons, for example those of the microwave background. Compared to supernova remnants, where gamma rays are most likely produced by interactions of accelerated nuclei with ambient gas, the upscattering process is very efficient in generating gamma rays, which explains the abundance of pulsar wind nebulae detected in high energy gamma rays (e.g. SOM 10/04, 6/05, 9/05, 4/6, or 5/07).
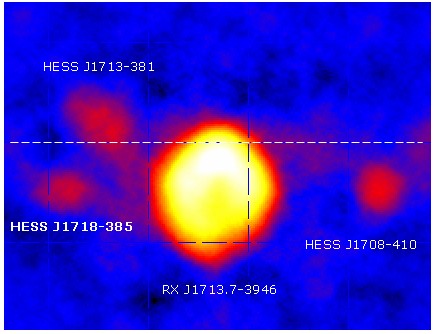
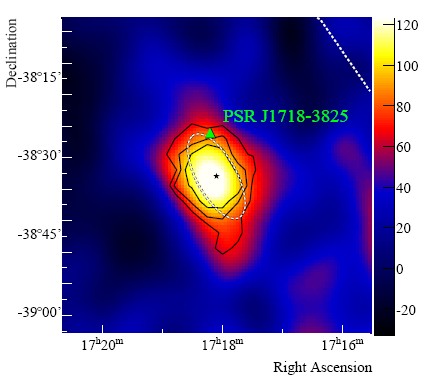
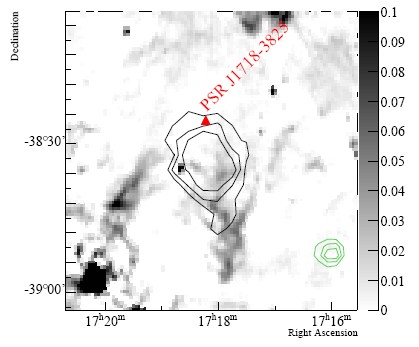
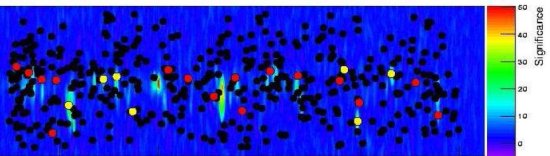
The new gamma-ray source HESS J1718-385 was discovered in a systematic search for gamma-ray emission associated with known pulsars, see top figure. A gamma-ray excess of about 8 sigma significance is seen near the pulsar PSR J1718-3825 (Fig. 1, Fig. 2). The initial survey analysis (Aharonian et al. 2005, 2006) had less exposure in this region, and the structure corresponding to HESS J1718-385 was not significant. The excess is slightly offset from the pulsar (Fig. 2). Similar offsets are observed for well-identified PWN such as Vela-X (SOM 5/06) or HESS J1825-137 (SOM 9/05); their origin is not yet understood in detail, but may be attributed to inhomogeneities of the ambient medium. Archival radio and X-ray data show no structures obviously associated with the pulsar or the gamma-ray source (Fig. 3). Firm identification of the gamma-ray source with the pulsar will require the search for a X-ray PWN in deeper X-ray exposures.
References:
Discovery of two candidate pulsar wind nebulae in very-high-energy gamma rays, H.E.S.S. collaboration, F. Aharonian et al., in preparation, arXiv:0705.1605