Oops - HESS J1745-303
January 2008
HESS J1745-303 - a very faint source of very high energy gamma rays of about 0.2 x 0.1 degr. size, slightly south of the Galactic equator, was first mentioned in the 2nd paper on the HESS Galactic Plane Survey (Aharonian et al. 2006). Based on 35 hours of exposure, mostly directed at the Galactic Center, with HESS J1745-303 relatively far off-axis, a 6 standard deviation gamma-ray excess was detected. Roughly coincident with an EGRET source of high energy gamma rays, 3EG J1744-3011, the source had no obvious counterpart in radio or X-rays. With a spectral index of 1.82 +/- 0.29 +/- 0.2, the source was remarkable in that it exhibited the hardest spectrum among all sources in the survey.
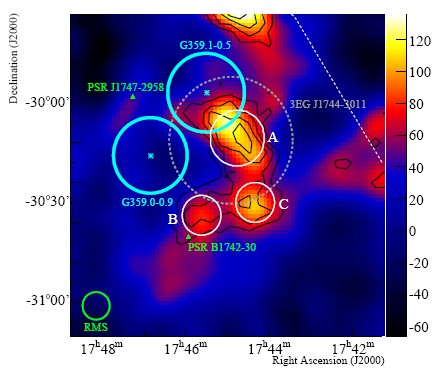
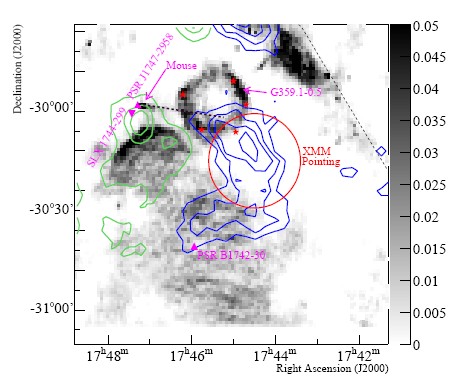
With increased exposure, HESS J1745-303 is now detected at a significance level of 12 standard deviations (Fig. 1). The emission appears to have a complicated morphology, with multiple peaks in the image, labeled A, B and C. However, the dips between the peaks are not highly significant, hence it would be premature to claim multiple sources. Also, the energy spectra from the three regions are consistent in shape, within errors. Nevertheless, multiwavelength data of the region suggest a composite source (Fig. 2). In region A, the shock wave of the supernova remnant G359.1-0.5 seems to border dense clouds, visible in CO emission (Uchida et al. 1992). Given an estimated density of the clouds of several 1000 molecules per ccm, the clouds could provide a perfect target for shock-accelerated protons in the middle-aged (>10000 years) remnant. The southern region B, on the other hand, could represent a pulsar wind nebula powered by PSR B1742-30, slightly offset from this region. While the pulsar is not energetic enough to plausibly account for all of HESS J1745-303, the emission from region B corresponds to about 2% of its loss of rotational energy, not uncommon for pulsar-driven nebulae. There is no compelling explanation for the emission from region C.
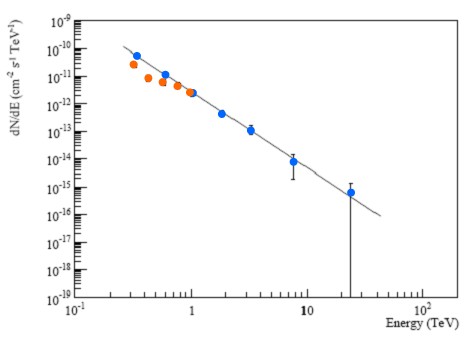
Why "oops"? While consistent in terms of morphology, the larger data set does, however, show differences in the gamma-ray spectrum, with a new spectral index determined to 2.71 +/- 0.11(stat.) +/- 0.2(syst.), about 3 standard deviations from the initial determination and more in line with typical galactic sources. The data now cover a much larger energy range (Fig. 3), compared to the very restricted range in the initial analysis; the difference can be traced to the lowest-energy data points. A reanalysis of the old data set with current analysis tools gives an index consistent with the new result, and numerous checks led us to believe in an underestimated systematic error in the original determination, resulting from a combination of the very low surface density of the source, which made it particularly susceptible to details of the background determination, and imperfections of the analysis tools at the time, for sources near the edge of the useful field of view where the detection efficiencies and background rates vary rapidly. A reanalysis of all other survey sources - which do not suffer from these peculiar conditions - did not reveal significant differences to published results. Targeted sources observed in "wobble" mode with a small and alternating offset from the optical axis of the instrument (essentially all extragalactic sources and re-observations of Galactic targets) are intrinsically much more robust.
References:
Aharonian at el., submitted.