The Crab Nebula
October 2004
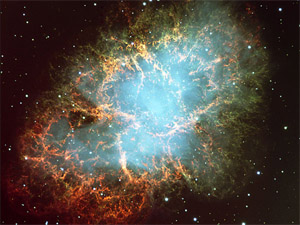
Since its discovery as a TeV source by the Whipple telescope in 1989, the Crab Nebula serves as a standard candle for TeV astronomy and usually is one of the first targets of new instruments. The nebula and the Crab pulsar were created in a supernova explosion observed in 1054 AD. Resulting primarily from inverse-Compton scattering of electrons accelerated in the termination shock of the pulsar wind, TeV gamma rays exhibit over a wide range a power-law energy spectrum; the flux shows no significant time dependence. With H.E.S.S., the northern-hemisphere Crab Nebula is visible only under relatively large zenith angles -- 45 degr. and above -- resulting in an elevated energy threshold around 500 GeV, compared to about 100 GeV for sources near the zenith.
Observations of the Crab Nebula were carried out already during the commissioning phase of H.E.S.S. in 2002 and 2003, with 2 and 3 telescopes participating in the observations. Data shown here were recorded with 3 telescopes in October 2003, for a total of 3.4 h. A strong signal clearly stands out above the background of cosmic rays (Fig. 1, Fig. 2). Gamma rays are detected with typical rates of 20/min. before cuts to reduce backgrounds, and 7/min. after cuts, resulting in a significance of detection of about 30 standard deviations for one hour of observations. The energy spectrum (Fig. 3) follows a power law with a spectral index of 2.57+/-0.05 (stat) and a flux above 1 TeV of (2.1+/-0.1(stat)) 10-11/cm2s . The agreement with previous measurements (e.g. by Whipple, HEGRA) illustrates that the calibration of the H.E.S.S. telescopes, the image analysis and the spectral reconstruction are well understood.
With the full 4-telescope H.E.S.S. system, a source of the strength of the Crab Nebula located near the zenith can be detected within 30 seconds with 5 standard deviations significance.
References:
F. Aharonian et al., Observations of the Crab Nebula with H.E.S.S., in
preparation
Calibration of
cameras of the H.E.S.S. detector
H.E.S.S. collaboration, F. Aharonian et al., Astropart. Phys. 22 (2004) 109-125