HESS J1825-137 - a Crushed Pulsar Wind Nebula?
September 2005
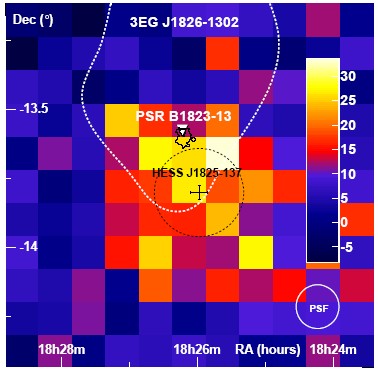
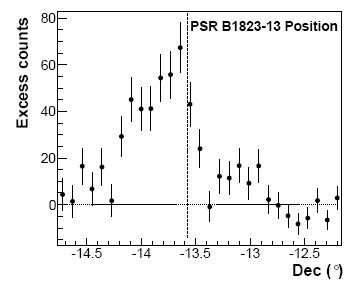
In the H.E.S.S. Galactic Plane Survey (Aharonian et al 2005), a number of new TeV gamma ray sources were discovered in the central region of our Galaxy, among them the source termed HESS J1825-137, located close to the pulsar PSR B1823-13, but not coincident with it (Fig. 1). Initially, it was not at all clear if there was a relation between the TeV source and the pulsar - with its age of about 20000 years (Clifton 1992) and an estimated distance of about 4 kpc (Cordes and Lazio 2002). However, closer inspection of the spatial distribution of TeV gamma rays revealed an asymmetric distribution, peaking at the pulsar and decaying toward the South (Fig. 2), as if the pulsar is emitting a wide beam of particles towards the South. This behavior is remarkably similar to the situation in X-rays, where the pulsar is surrounded by a nebula (Finley et al. 1996) with a pronounced tail towards the south (Gaensler et al. 2003, black contour in Fig. 1), except that the scales are different: the X-ray tail has a characteristic scale of a few arcmin., compared to a fraction of a degree for TeV gamma rays.
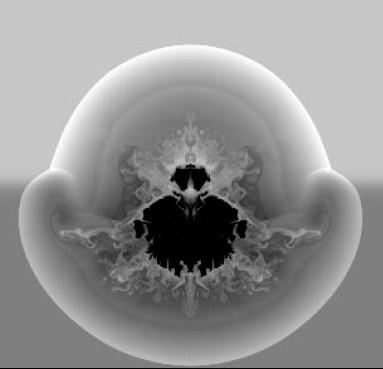
One explanation is that we are seeing a pulsar wind nebula - a nebula generated by the stream of relativistic electrons and positrons from the pulsar - which started out symmetrically from the pulsar, but where one side (the top, North part) was crushed by the reverse shock rebouncing when the supernova shock wave had piled up enough interstellar material to generate a significant pressure (see image and text on top). In case the supernova expanded into an inhomogeneous media, the reverse shock from the (lower-density) south side may not yet have reached the pulsar wind nebula. Such scenarios were modeled by Blondin et al, (2001).
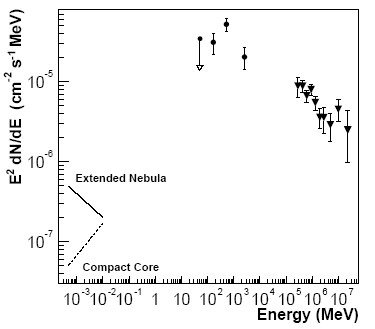
The interpretation raises a number of questions: (i) Why is the X-ray nebula so much smaller than the TeV nebula? A plausible explanation is that given the 10 Microgauss magnetic field estimated for the nebula, the X-rays are emitted by higher-energy electrons than the gamma-rays. Such high-energy (100 TeV) electrons lose their energy quickly and to not propagate as far. For the same reason, the X-ray energy flux is well below the flux observed in gamma rays (Fig. 3). (ii) Where and how big is the associated supernova shell? So far, it escaped detection. (iii) Why is the pulsar wind nebula so large? Taking the 20000 year estimated age of the pulsar, the supernova must have exploded into a very low-density medium in order to allow the nebula to expand so quickly. Future, more sensitive observations in different wavelength regions should help to unravel the dynamics of this interesting system.
References:
A possible association of the new VHE -ray source HESS J1825–137 with the pulsar wind nebula G18.0–0. , H.E.S.S. collaboration, F. Aharonian et al., submitted to Astronomy & Astrophysics