HESS J1912+101 - Yet Another Pulsar Wind Nebula?
May 2007
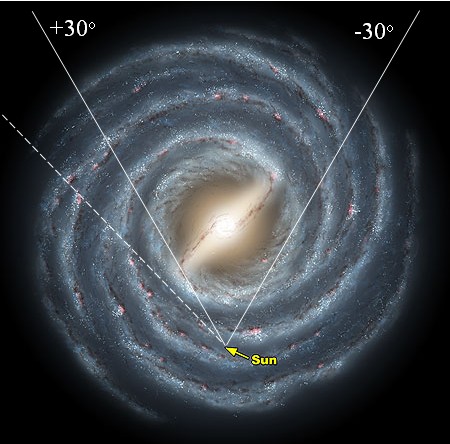
The H.E.S.S. survey of the Galactic Plane (Aharonian et al. 2005, 2006) initially covered the range from -30 degr. to +30 degr. Galactic longitude. More recently, the survey region was extended to cover more than twice the longitude range, out +60 degr. In this newly covered region, the number of new gamma-ray sources is somewhat smaller than in the original survey region, which can be attributed both to the reduced amount of mass along the line of sight (top figure) and to the fact that larger positive longitudes are observed at increasingly unfavorable zenith angles, reducing the sensitivity of the instrument. One of the new sources is HESS J1912+101, located at l=44.4 degr., b=-0.1 degr.
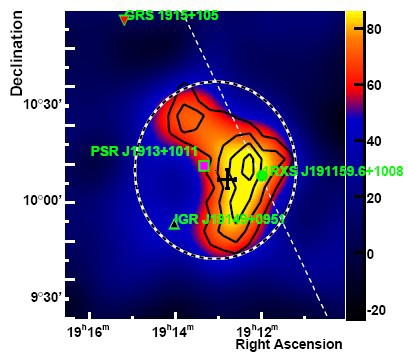
Fig. 1 shows a smoothed gamma-ray map of the region around longitude l=44.5 degr. HESS J1912+101 is visible as an extended excess of gamma rays. The source was initially detected in a search for slightly extended sources, summing up gamma-rays within a radius of 0.22 degr. from a given sky position - the same cut as used in the published survey. A gamma-ray excess of 7.7 sigma was visible, or about 5.7 sigma taking into account the trails factor accounting for the large number of sky positions probed in the survey. The source is clearly extended with an intrinsic rms source size of about 0.25 degr. With a larger integration radius of 0.46 degr. - the dashed circle in Fig. 1 - the significance increases to 8.4 sigma (pre-trials), with a signal of 337 gamma rays. The total gamma ray flux is about 10% of the flux of the Crab Nebula.
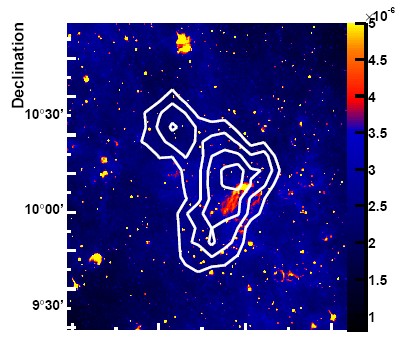
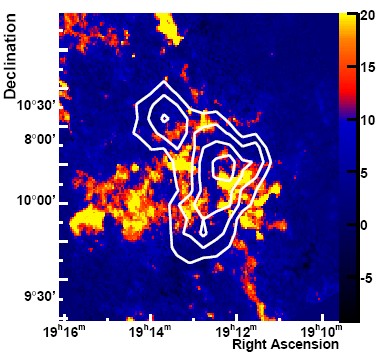
Close to the center of HESS J1912+101 is the pulsar PSR J1913+1011 (Manchester et al., 2005), which suggests that HESS J1912+101 might be powered by an outflow of highly relativistic electrons and positrons from the pulsar, generating an extended pulsar wind nebula (PWN). With a spin-down luminosity of 2.9 x 1036 ergs/s and a distance of about 4-5 kpc, less than 1% of the pulsar's spin-down power would be needed to account for the gamma-ray flux, a value well within the range observed for other PWN. The relatively large size of the source could be attributed to the age of 1.7 x 10⁵ years of the pulsar. The lack of spherical symmetry of the nebula is a characteristic of many gamma-ray PWN and X-ray PWN (e.g. SOM 9/2005). A search for other possible counterparts reveals a faint ROSAT X-ray source (Fig. 1) (Voges et al. 2000) co-located with an infrared source (Fig. 2) as well as indications of molecular clouds, which are seen as an enhancement in 13CO emission in the velocity range corresponding to the pulsar distance, with the H II region G044.3+00.1 (Paladini et al. 2003) (Fig. 3). The presence of this target gas and dust allows an alternative interpretation of gamma-ray production in terms of proton acceleration and interactions.
References:
H.E.S.S. collaboration, F. Aharonian et al., in preparation