The Crab Nebula is Extended
October 2017
The Crab Nebula is one of the best-studied astrophysical objects of all time and shines across the whole accessible electromagnetic spectrum, from radio wavelengths up to very high energy (VHE, E > 100 GeV*) gamma-rays ([1], [2]). It is powered by the Crab Pulsar, a fast-rotating neutron star (period P = 33 ms) possessing an ultra-strong magnetic field. It was created during a supernova explosion seen in the constellation Taurus in 1054 A.D. A part of the rotational energy of the Crab Pulsar is converted into electron-positron pairs, forming a pulsar wind. The electrons and positrons are shocked and accelerated to ultra-relativistic energies at the wind termination shock. These high-energy particles propagate outwards and lose energy via the emission of synchrotron and Inverse Compton (IC) radiation resulting from interactions with magnetic and photon fields, respectively. The synchrotron radiation ranges from the radio regime up to around 1 GeV, and its emissivity depends on the density of high-energy particles and the strength of the magnetic field. Thus, the spatial extent of the synchrotron emission is determined by a convolution of the local electron distributions with the magnetic field, where the latter is expected to vary significantly through the nebula. The second important emission mechanism is IC scattering: Energetic electrons and positrons can transfer a fraction of their energy onto photons thereby transforming these to high-energy and VHE gamma-rays. In the case of the Crab Nebula, the dominant target photon field is the synchrotron emission of the nebula itself, generated by the same particle population. This photon field is expected to be more homogeneous than the magnetic field. Thus the IC emission can be taken as a much more reliable tracer of the distribution of relativistic electrons, revealing more about the underlying physics of one of the Milky Way's most prominent and interesting particle accelerators.
Until now, the morphology of the Crab Nebula has only been resolved with radio, optical, and X-ray telescopes, up to photon energies of around 80 keV [1,3]; at higher energies, no extension could be measured mainly due to the worse angular resolution of the corresponding instruments. For telescopes like H.E.S.S., the expected size of the Crab Nebula is several times smaller than the point spread function (PSF**). In such a case, the intrinsic extension of the source only leads to a slight broadening of the signal as compared to the PSF, which itself however strongly depends on the actual observation and instrument conditions. For the first time, we employ simulations that take into account all these conditions and thus lead to a considerably improved PSF description [4]. This allows to probe source extensions well below one arcminute***, which corresponds to a new level of resolving source sizes in VHE gamma-ray astronomy.
Here we used 25.7 hours of high-quality observations of the Crab Nebula, taken with all four of the small telescopes of H.E.S.S. The analysis settings were chosen to achieve a good PSF; for this source and observation conditions, 68% of the gamma-rays from a point source are reconstructed within 0.05° (3 arcminutes) of the source direction.
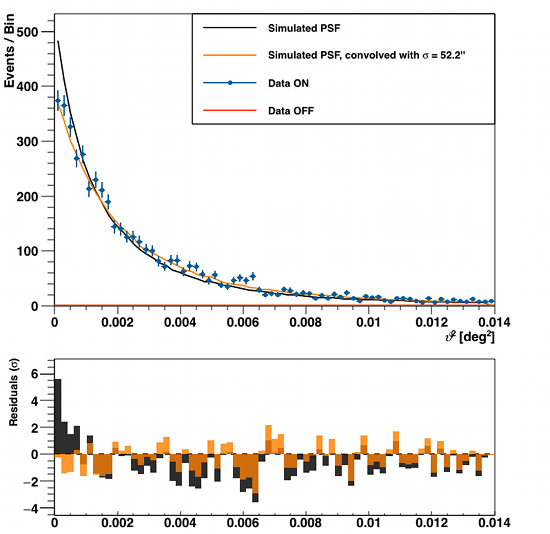
The distribution of events from the Crab Nebula as a function of the
(squared) distance to the source is shown in Figure 1 (blue
crosses). For comparison, the PSF is shown as well (black) and is
obviously highly inconsistent with the data, where the probability for
consistency of the two distributions amounts to merely around
10-14. The broadening of the data distribution with respect to the PSF
can only be explained when assuming an intrinsic source extension. The
PSF was iteratively convolved with a Gaussian source model of
different width. The extension is obtained by comparing the
compatibility of the data and the convolved PSF each time, and the
best-fit extension is found to be σCrab = 52.2'' ±
2.9''
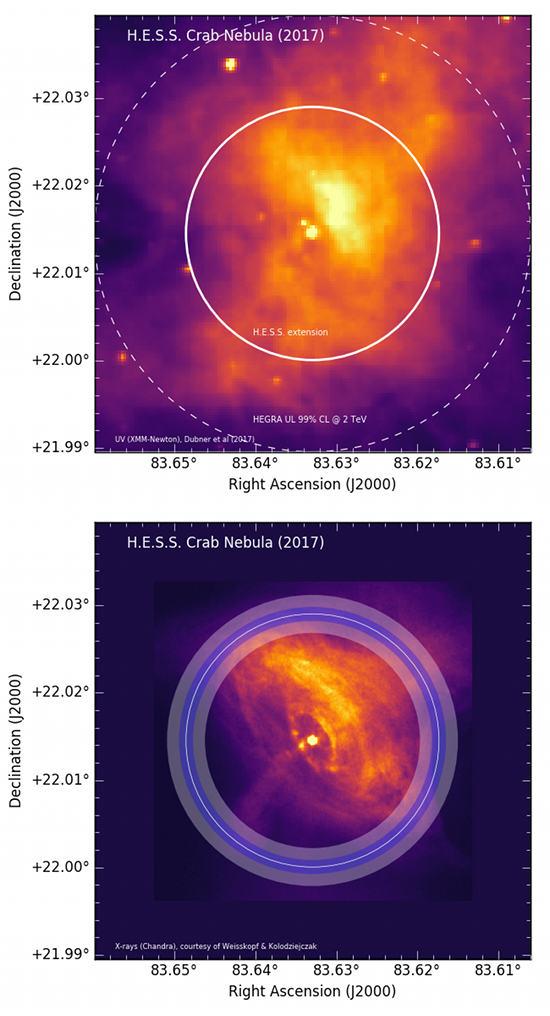
Our resulting Gaussian width is overplotted on images of the Crab Nebula at UV wavelengths (λ = 291 nm) and X-ray energies (0.1 - 10 keV) on the top and bottom of Figure 2, respectively. While the gamma-ray extension is obviously small compared to the optical/UV size, it is the other way around when comparing the gamma-ray to X-ray extension. This can be understood when considering the energetics of the electron population responsible for the respective emission.
The X-ray emission of the Crab Nebula is confined to a smaller region than the UV emission, because the latter is mainly from electrons with E ~ 1 TeV, whereas the former, the X-ray emission, is mainly from electrons with larger energies (~ 10 TeV). Since electrons lose energy more efficiently at higher energies, a shrinking of the pulsar wind nebula with increasing energy is indeed expected. Until now, the window between UV and X-ray energies and the corresponding morphology has never been constrained observationally. Now with our new H.E.S.S. measurement, we are closing that gap by measuring the extension of the IC emission of the Crab Nebula in the range where electrons with energies of several TeV dominate. This naturally explains why the size we obtain lies in between the UV and X-ray extension.
Resolving the extension of the Crab Nebula with the H.E.S.S. array is a milestone in the study of the gamma-ray sky with Cherenkov telescopes, and demonstrates the power of simulations to characterize the instrument performance, with potential applications for the upcoming CTA era.
(*) 1 GeV = 109 eV and one eV (abbreviation of electron-volt) is a unit of energy which, by definition, represents the amount of energy gained by an electron when accelerated by an electric potential difference of 1 volt.
(**) The PSF corresponds to the distribution of reconstructed event directions from a point source. In other words, it describes how a gamma-ray point source appears widened up the instrument.
(***) One arcminute corresponds to 1/60th of 1°. An arcminute (or 1') can be further subdivided into 60 arcseconds (60''). 1° thus equals 3600'', making it the angular equivalent of an hour.
References:
[1] Hester, J. J. The Crab Nebula: An Astrophysical
Chimera. ARA&A 46, 127-155 (Sept. 2008)
[2] Bühler, R. & Blandford, R.: The surprising Crab
pulsar and its nebula: a review. Reports on Progress in Physics 77,
066901 (June 2014)
[3] Madsen et al.: Broadband X-ray Imaging and
Spectroscopy of the Crab Nebula and Pulsar with NuStar. ApJ 801, 66
(March 2015)
[4] Holler et al.: Run-Wise Simulations for Imaging
Atmospheric Cherenkov Telescope Arrays. Proceedings of the 35th ICRC,
contribution 755 (July 2017)
[5] Weisskopf et al.: Discovery of Spatial and
Spectral Structure in the X-ray Emission from the Crab Nebula. ApJ
Letter 536, 81-84 (June 2000)
[6] Gaensler, B. M. & Slane, P. O.: The Evolution and
Structure of Pulsar Wind Nebulae. ARA&A 44, 17-47 (Sept. 2006)