PG 1553+113 - the mystery AGN
February 2006
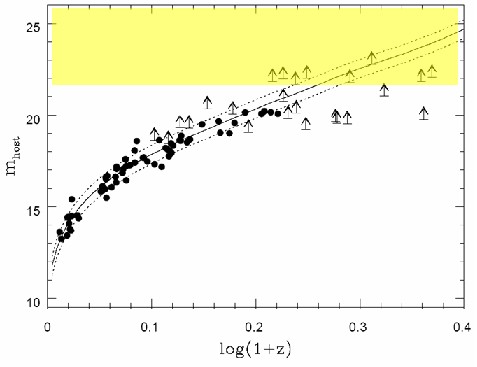
The object PG 1553+113 was discovered in the Palomar-Green survey of stellar objects with excessive UV emission (Green et al. 1986). Since its spectrum does not exhibit prominent emission or absorption lines (Miller and Green, 1983, Falomo and Treves 1990) and since its brightness is variable, it was classified as a BL Lac object (Giommi et al. 1995), i.e. as an active galactic nucleus where most of the emission is attributed to a matter jet emerging from the central black hole, and pointed towards the observer. This classification is confirmed by X-ray emission (Perlman et al. 2005,Donato et al. 2005). A subject of long discussion, however, was the redshift of PG 1553+113, i.e. its distance. Initially, a redshift of z=0.36 was attributed by Miller and Green (1983) on the basis of a faint emission line. Falomo and Treves (1990) pointed out that this "line" was a spurious flaw in the image, that was misidentified as the Lyman-alpha line. Even in images taken with 8 m class telescopes, no genuine lines were found. Also, no host galaxy could be resolved in images taken with the Hubble Space Telescope (Scarpa et al. 2000). For most "nearby" BL Lac objects, a host galaxy is detected (see top figure), and a lower limit on the redshift of z>0.78 was given by Sbarufatti et al, (2005) , making this a rather distant object.
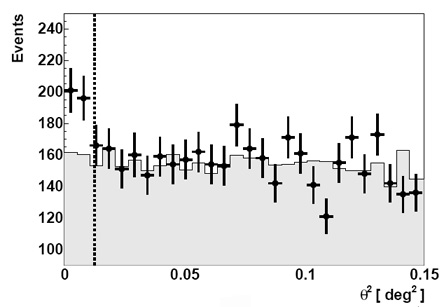
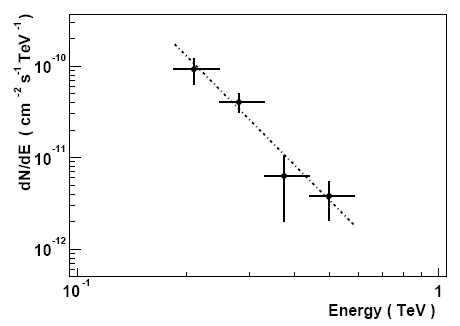
On the basis of its flux in the X-ray and radio domains, PG 1553+113 was selected as an observation target for H.E.S.S. (seeNov. 2005, Fig. 1). This happened before the redshift limit z>0.78 was published; due to absorption of gamma rays in interactions with the infrared and optical radiation in the space between galaxies (see Dec. 2005), an object at such a distance should not be detectable. Surprisingly, a hint for very-high-energy gamma ray emission was found in the H.E.S.S. data (Fig. 1), initially with a significance of about 4 standard deviations, increasing with more than 5 standard deviation when the selection criteria were optimized for steep-spectrum sources. Since high-energy gamma rays are more strongly absorbed, surviving gamma rays for very distant sources are expected to show a flux which rapidly decreases towards high energy. Indeed, the measured spectrum (Fig. 2), with a spectral index around 4, is among the steepest spectra ever measured in the TeV regime.
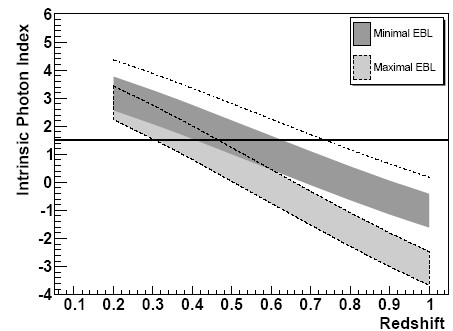
Based on the detection of two other active galaxies,1 ES 1101-232 and H 2356-309, the H.E.S.S. collaboration showed that there is less radiation in the space between galaxies than previously assumed (see Dec. 2005). The detection of PG 1553+113 - if indeed at a large redshift - dramatically supports this result. With radiation levels at the upper limit allowed from the earlier H.E.S.S. data, the redshift for a source with such a spectrum cannot exceed ~0.45 (Fig. 3), in conflict with the lower limit derived from the Hubble images. Only with radiation levels near the very minimum possible value, counting only light from known galaxies, a redshift up to ~0.65 to 0.75 is tolerable, marginally consistent with the Hubble limit of Sbarufatti et al, (2005). We note, however, that a recent analysis also based on the lack of detection of the host galaxy gives a more conservative lower redshift limit of z>0.09 (Sbarufatti et al., 2006). Obviously, efforts should be made to reliably establish the redshift of this interesting object!
References:
Evidence for VHE gamma-ray emission from the distant BL Lac PG 1553+113, F. Aharonian et al., Astronomy & Astrophysics, in press andastro-ph/0601545