The Long Term Variability of the Blazar Markarian 501 - Getting to Know Your Neighbours Better!
April 2019

Another month, another source! After a look to the full H.E.S.S. extragalactic survey given last month, the April source of the month is dedicated to our extensively studied neighbouring blazar Markarian 501 (often indicated by its nickname, Mrk 501).
To the community of very high energy astrophysicists, this blazar is very famous. It was the second extragalactic object ever detected by a Cherenkov telescope [1] and its notoriety comes from a couple of features it presents:
- It is nearby. At redshift z of 0.034, it is at a distance of roughly 460 million light years (and in cosmological terms, this means close ;-) )
- It is highly variable with gamma ray flux changes by a factor greater than 10. This provides a laboratory for exploring extreme environments where gamma rays are produced.
In the study of blazars, variability is a very important aspect to probe the emission mechanisms. Some time ago we reported on the behaviour of another familiar blazar, PKS 2155-304, and discussed the characteristics of its long term variability in the gamma ray energy range (for the full paper see [2]). PKS 2155-304 shows flicker-noise type behaviour with a long term average power spectral density following a power law with index close to -1 (see Figure 1). Thus, there is more power at longer timescales with respect to shorter ones, with a scale-free structure in the time variability at different frequencies. Furthermore, for PKS 2155-304, we found that the gamma-ray emission followed a log-normal distribution, linked to the presence of multiplicative processes at the root of its variability (see [2] for more details on this source).
Here we investigate the variability of Mrk 501, focusing on the shape of the flux distribution, searching for evidence of log-normality in its gamma-ray emission.

The event that sparked this study was the extremely bright flare that happened in June 2014. While the details of the flare itself were discussed last September in the context of probing the quantum scales with gamma rays (see also full paper [3]), here we include information from longer timescales and lower energies from other telescopes. For this particular project, we use data from the Fermi-LAT space telescope [4] and collaborate with the team of the First G-APD Cherenkov Telescope (in short, FACT, [5]) located in La Palma in the Canary Islands. This telescope is smaller than the "small" telescopes at the H.E.S.S. site, but its camera is equipped with a different technology allowing observations even in conditions of higher night sky background (e.g. presence of Moon in the sky disrupts observations of a more traditional type of Cherenkov telescope). Furthermore, being in the Northern hemisphere, it has a vantage position when looking at Mrk 501 [6] which is one of its continuously monitored sources, looking at it in an unbiased way, regardless of its flux state. Owing to timely triggers from FACT, the flare was observed with H.E.S.S.: our colleagues alerted us that something was going on with Mrk 501 and that triggered the H.E.S.S. observation. The synergy between the three telescopes allows us to probe different timescales and energy ranges (the data are shown in Figure 2):
- H.E.S.S., the most sensitive of the three to probe the minute time scale during the flare;
- FACT, to explore the daily time scales thanks to an unbiased monitoring of this source;
- Fermi-LAT, giving us the GeV range light curve over its multi-year monitoring.
When dealing in particular with the variability of distant AGNs in the gamma-ray regime, the characteristic timescales can often be comparable with the length of the lightcurves available with our instruments (actual gamma-ray telescopes have existed only for the last 2 decades!). For this reason it is important to determine the statistical significance of our findings, obtained on "short" lightcurves. This is done by the heavy use of simulated datasets constructed with different power spectra and different flux distributions. These synthetic lightcurves are then compared with real data to asses which parameters better describe the observed in accordance with our models.
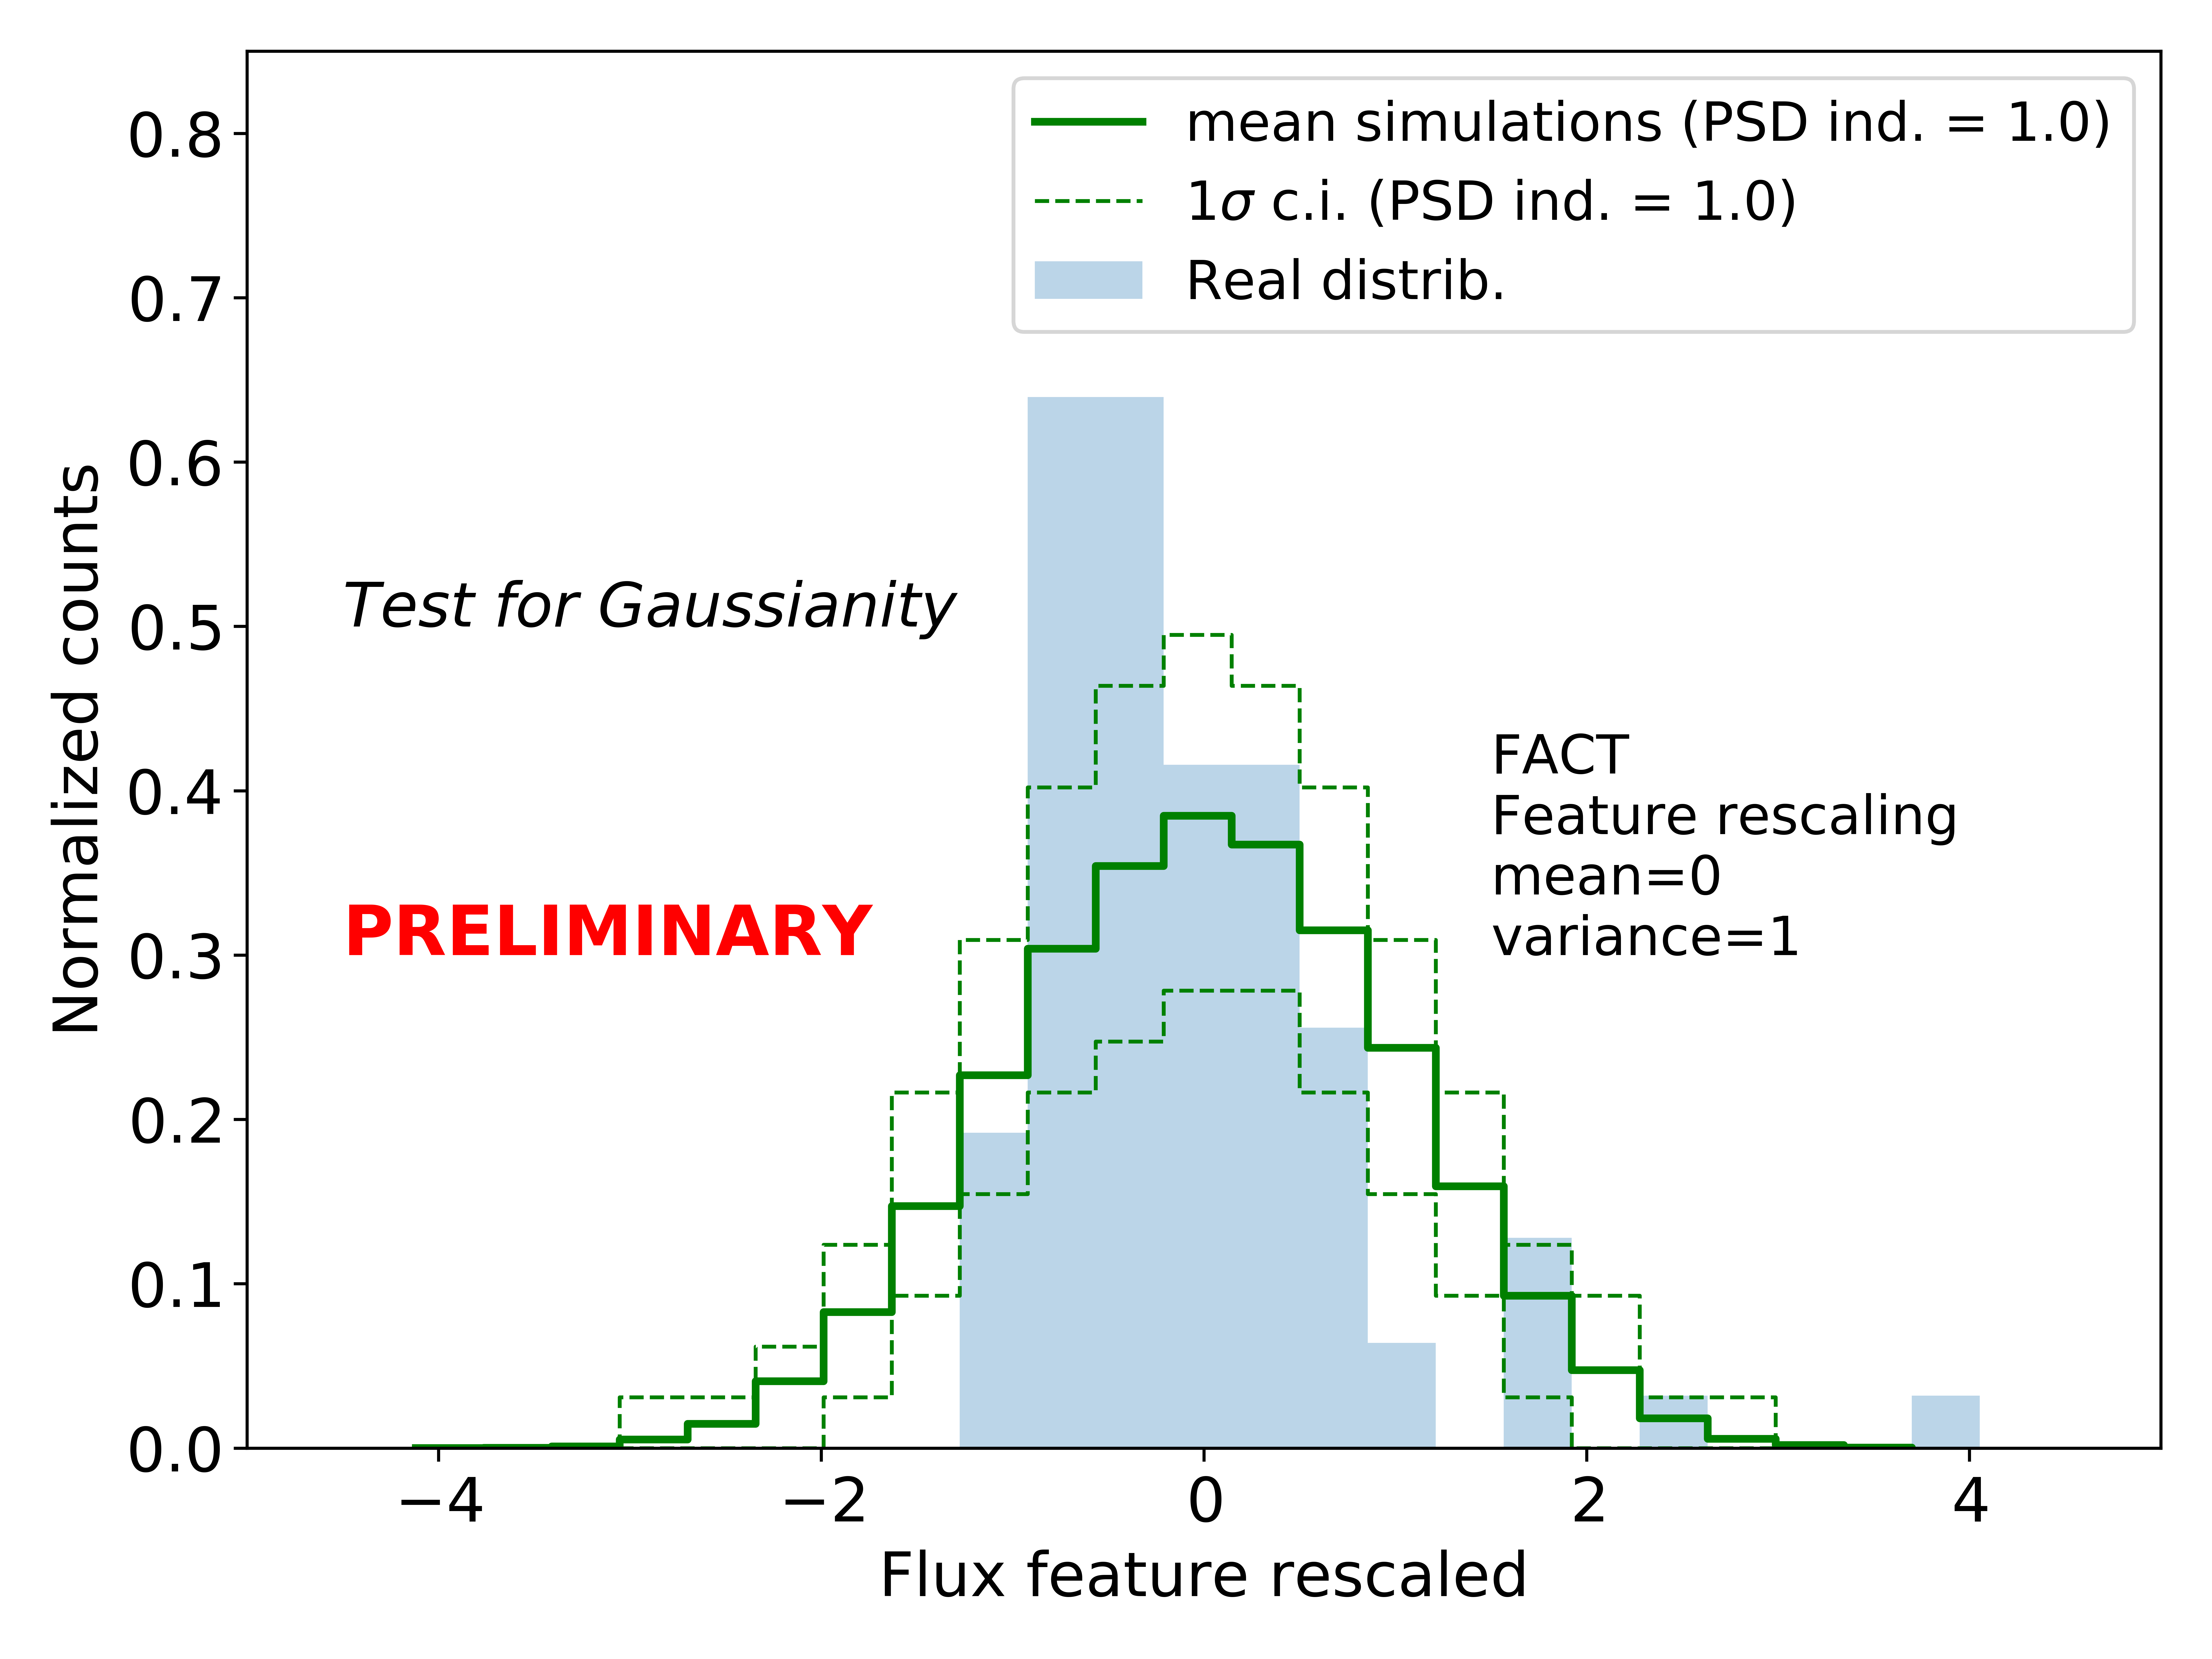
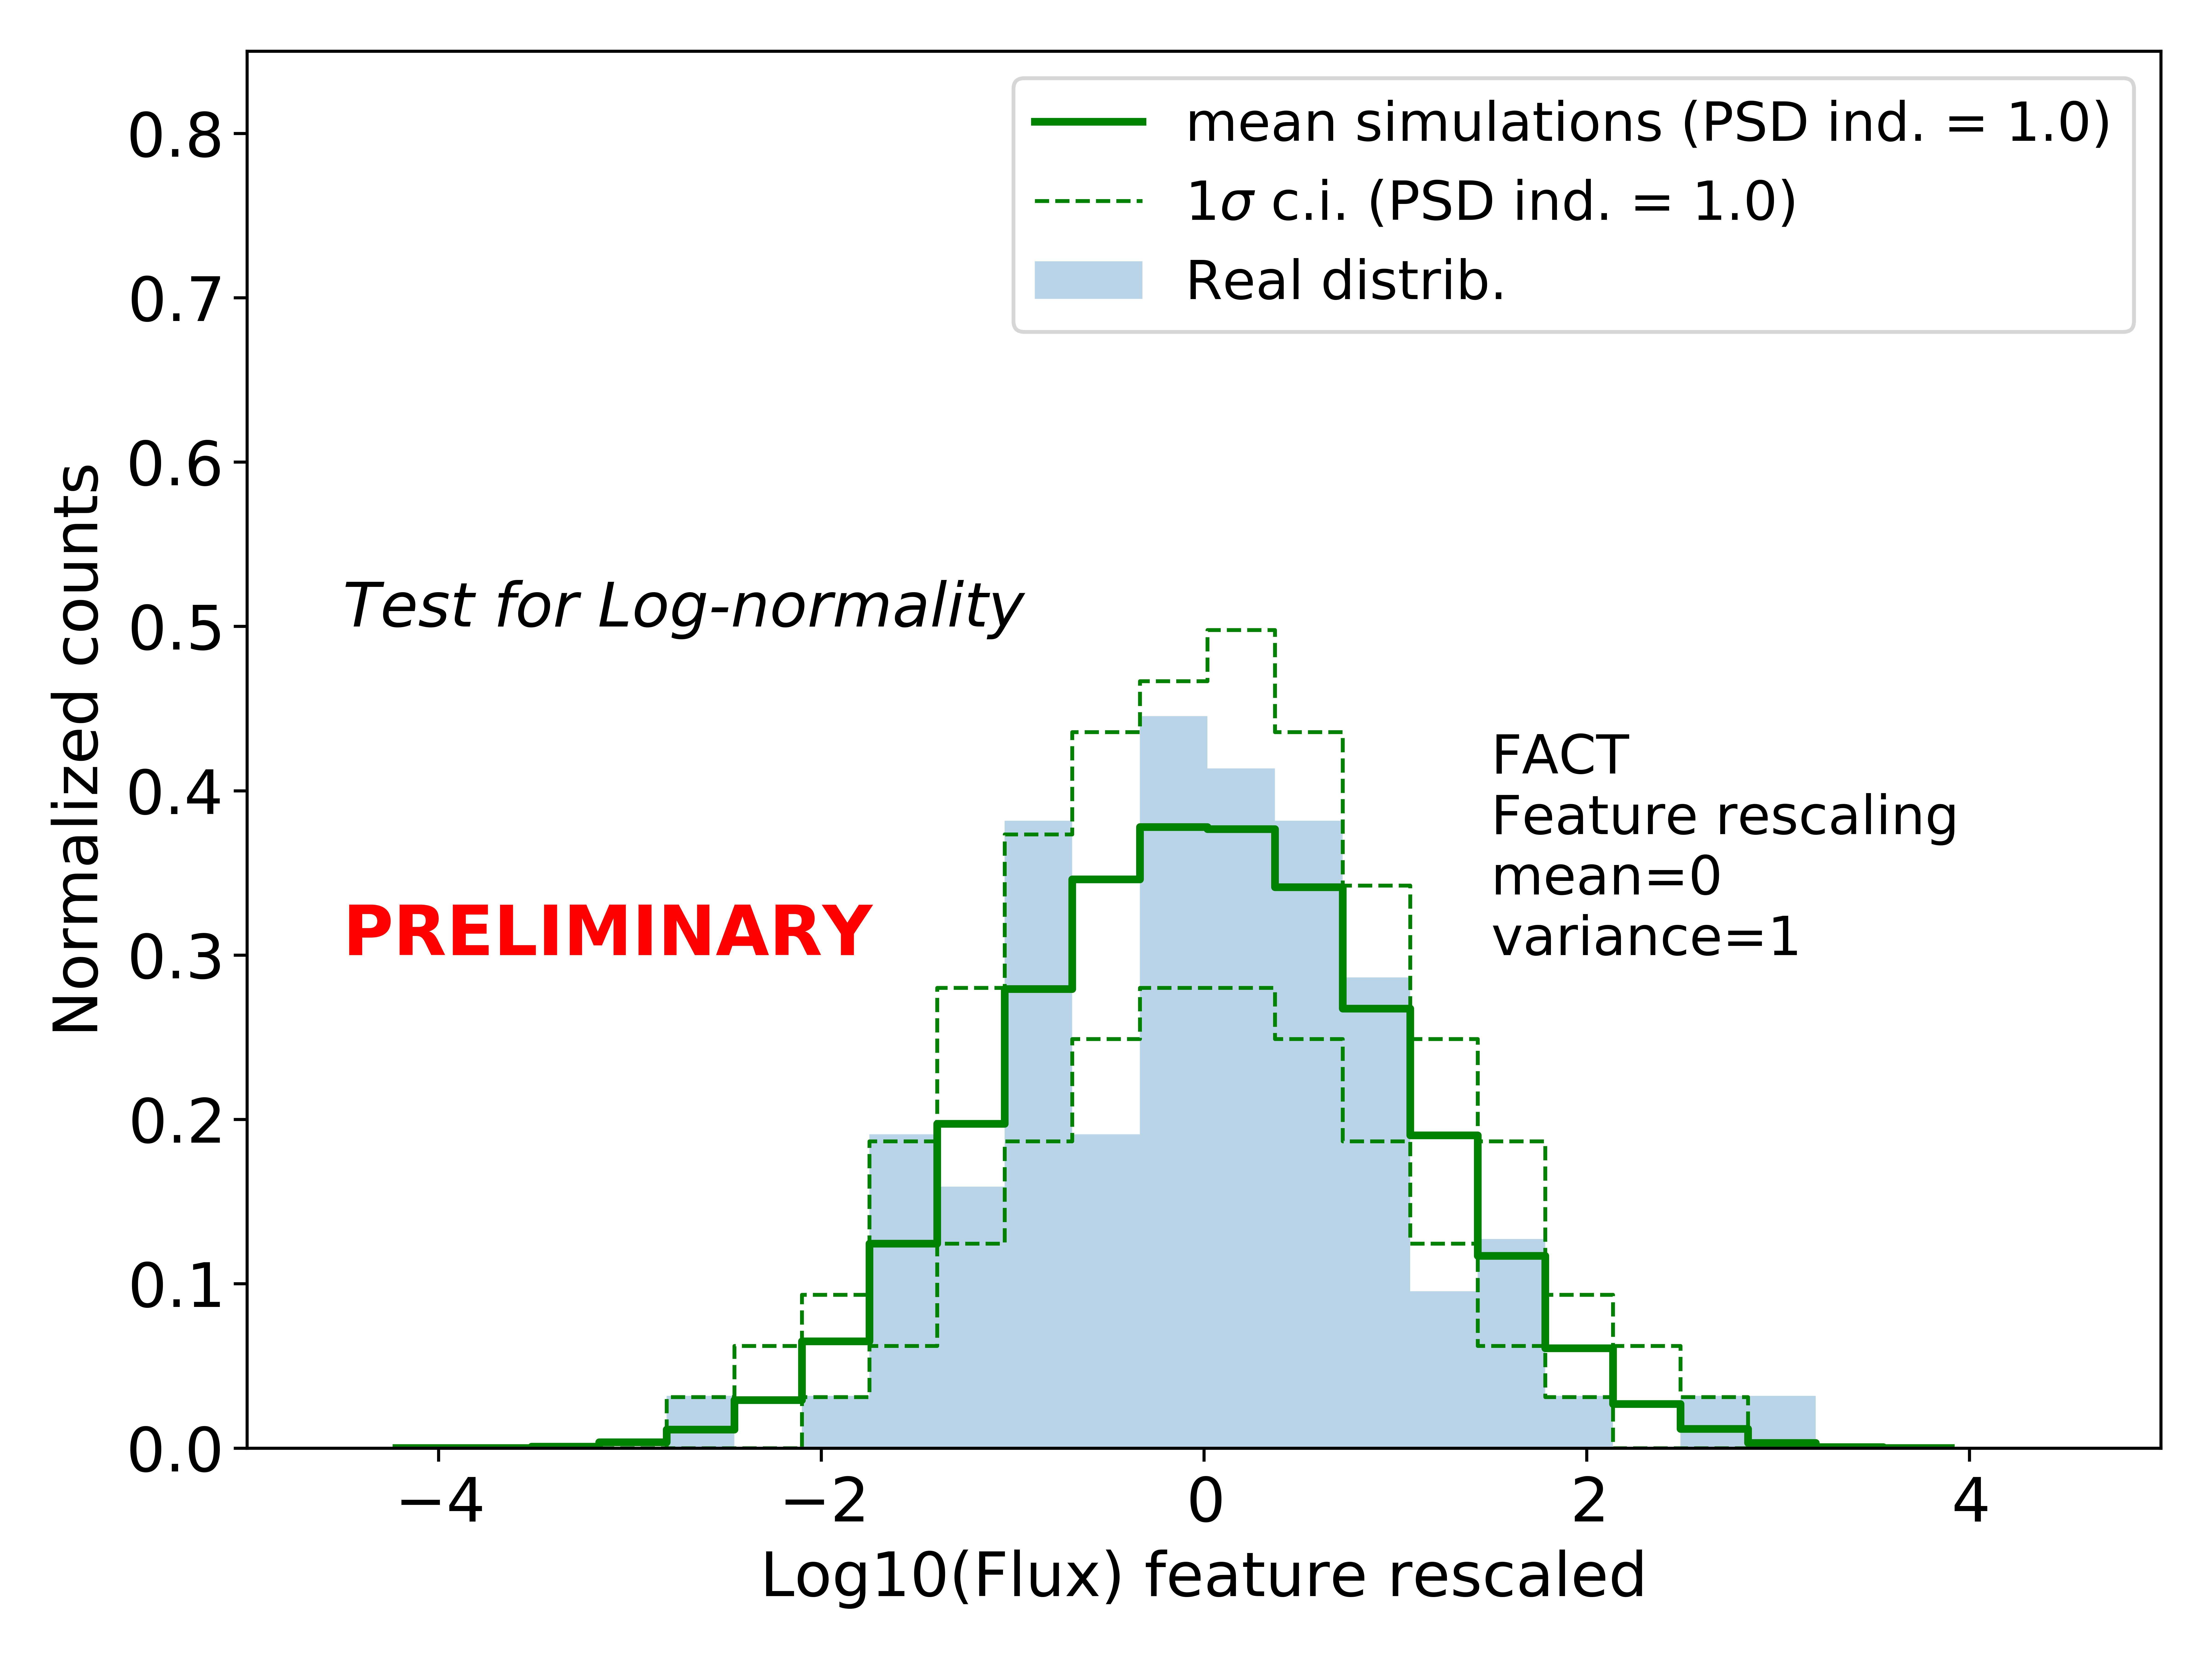
The Fermi-LAT data probe the longest (multi-year) timescales, but given the brightness level of the source in the GeV band, we do not have the statistics to go much below a monthly binning [8]. When considering these timescales, the situation is a bit unclear and it is not possible to fully determine if the flux distributions are Gaussian or log-normal (there is a slight preference for log-normality, but without a strong statistical significance). The situation changes drastically, however, when looking at the higher energy FACT data. Here we have a perfect trade-off between the sensitivity and coverage: we can access fluxes in nightly bins over a time interval of 3 months (and there is a flux point almost every night, thanks to FACT's monitoring strategy). From the histogram of this dataset in Figure 3, we can clearly reject the hypothesis that the distribution is Gaussian (the probability is below 10-7%!) and it is visible from the comparison between our simulations (which we tailor to be Gaussian or log-normal, see green lines in Figure 3) and the actual data. The H.E.S.S. analysis is also in line with these results, showing a preference for a log-normal behaviour.


The complex, statistical behaviour including the presence of flickering and log-normality appears to be commonly found in AGN observations across the electromagnetic spectrum. It provides a unique window into the mechanisms at play in these intriguing sources. This motivates further studies with larger datasets and sophisticated analysis methods to investigate these fascinating sources.
References:
[1] J. Quinn et al., "Detection of Gamma Rays with E > 300 GeV from Markarian 501", Astrophys. J. Jett. 456 (1996) 83
[2] H.E.S.S. Collaboration (H. Abdalla et al.), "Characterizing the gamma-ray long-term variability of PKS 2155-304 with H.E.S.S. and Fermi-LAT", Astron. Astrophys. 598 (2017) 39
[3] H.E.S.S. Collaboration (H. Abdalla et al.), "The 2014 TeV Gamma-Ray Flare of Mrk 501 Seen with H.E.S.S.: Temporal and Spectral Constraints on Lorentz Invariance Violation", Astrophys. J. 870 (2019) 93
[4] The LAT (Large Area Telescope) is a gamma-ray detector onboard the space satellite Fermi. This instrument, sensitive in the Gigaelectronvolt energy range, has been monitoring the sky since August 2008.
[5] Have a look here to learn more about it. You can also look at their performance paper here and at the details of their monitoring and quick look analysis here.
[6] Because of the principle of operation of a Cherenkov telescope, an important parameter in the observation is the "zenith angle" that is the angle between the telescope vertical and the source position in the sky (or you can use the complementary "elevation angle", the angle between the horizon and the position of the source in the sky). The larger the zenith angle, the more atmosphere the Cherenkov photons have to cross and the higher the probability to be absorbed before they can be successfully detected. This brings an increase in the energy threshold of the observation because only the highest energy gamma-rays can give enough Cherenkov light for a detection.
[7] Anderhub H., et al. 2013, "Design and Operation of FACT - The First G-APD Cherenkov Telescope", J. Instrum. 8 (2013) P06008
[8] Fermi-LAT is a "small" instrument. Its effective area is roughly 1 m2 and at these energies the fluxes are very low. A flux of 10-8 photons per cm2 per second means that a gamma-ray photon hits the telescope on average only every 2.7 hours. To have a good determination of the flux, we need hundreds of photons.