The H.E.S.S. I legacy extragalactic survey
March 2019
From the beginning of the H.E.S.S. I four telescope observations, until the upgrade with the addition of the 28m diameter telescope marking H.E.S.S. phase II (January 2013), H.E.S.S continuously observed both the galactic and extragalactic regions of the sky. Over the course of the 10 years of this first phase of the instrument, the H.E.S.S. observation program aimed at unveiling the mysteries of the very high energy sources in the Universe by trying to increase the number of known cosmic accelerators detected. For our Galaxy, this led to the publication of the legacy survey of the Milky way by H.E.S.S in 2018 (highlighted in the SOM 2016/01), comprising 77 sources of VHE gamma-rays [1]. Roughly the same amount of observation time was devoted to the observation of extragalactic parts of the sky, leading to the discovery of more than 20 sources, significantly increasing the number of known extragalactic very high energy sources. Apart from the field of views of those sources, some regions of the sky were also observed without a significant detection of a source being made.
Thanks to the advent of advanced analysis techniques, the entirety of the H.E.S.S I extragalactic observations have been comprehensively re-analysed in a uniform manner in order to build a unique catalog of extragalactic sources and probe the source population with almost a decade of data in the TeV energy range.
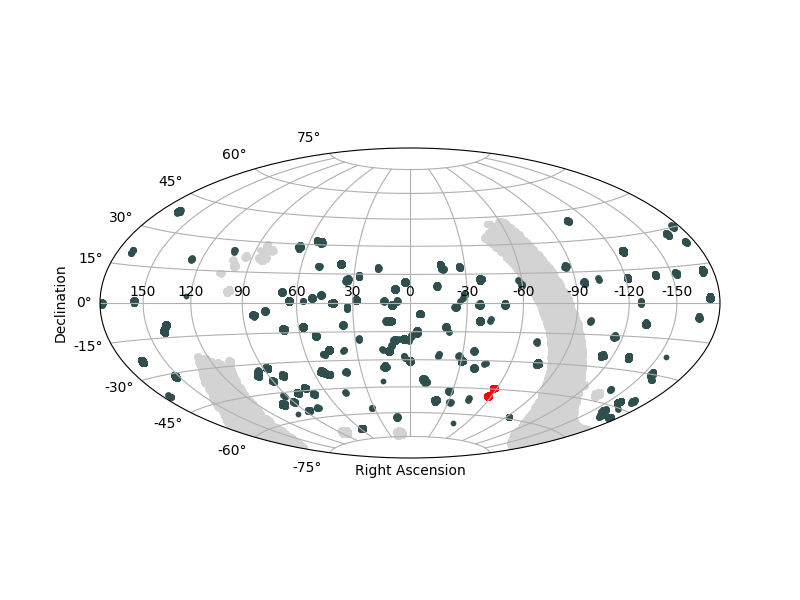
Fig. 1 shows the H.E.S.S. extragalactic fields from the data set presented here. This corresponds to the whole set taken through H.E.S.S. phase I observations, from which the galactic plane region of the sky has been removed (i.e., Galactic latitude |b| < 10°), as well as fields of view of other galactic sources such as the large and the small Magellanic clouds, or SN 1006 (grey regions in Fig. 1). In this analysis, observations taken sufficiently close together were clustered using an algorithm (DBSCAN from the scikit-learn library(, which yielded in total 113 observation fields (see dark dots in Fig. 1). These fields cover more than 6% of the extragalactic sky and are the result of about 2600 hours of observation.
As for the Galactic plane survey, a set of maps is derived for each field-of-view. These maps represent either the statistical significance of the observed signal to deviate from a background fluctuation, an estimate of the flux, upper limits on the flux of a potential source or the sensitivity. Using these maps, a comprehensive search for sources within these fields was performed. Beyond this, a comparison was also made of the H.E.S.S. observation null detections (upper limits) to results from other instruments.
In addition, the time dimension was also investigated by performing a comprehensive blind search for transient or variable sources in the field-of-view regions observed. To do this, a new method has been developed. It computes - at each observed position - the excess of gamma-rays detected during a given observation with respect to all the other (excess-less) observations. For this, the significance of the excess can be computed and maps showing the variability can be built by reporting the highest significance value.
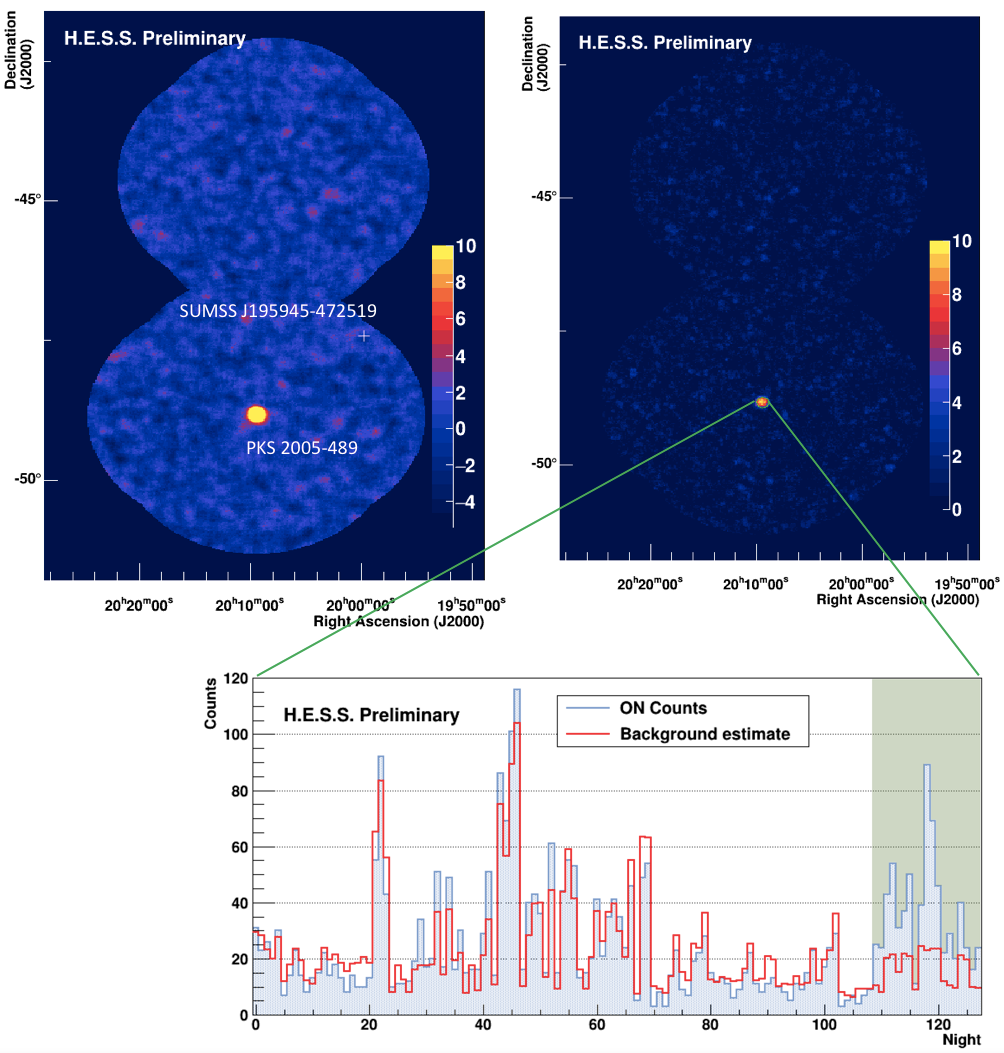
For the purpose of example, Fig. 2 shows the field of view observations containing the blazar PKS 2005-489, which was contained in the cluster highlighted in red in Fig. 1. This source was previously detected by H.E.S.S. [2]. In the significance map (Fig. 2. left), the source is well visible at more that 40 sigma. Previous H.E.S.S. observations have revealed the source to be highly variable [3], and our variability detection tool confirms this high level of variability (more than 10 sigma - see the right hand panel in Fig. 2). The bottom plot of Fig. 2 shows the number of events in the ON time-region (grey) and the background count in red as a function of the observation night. The green shaded region in the figure indicates the significant flare period detected. In total, the re-analysis of the data from the first phase of the H.E.S.S. telescopes led to the re-detection of 24 sources. Among these 24 sources, 6 were identified as exhibiting significant variability.
Within the H.E.S.S. I extragalactic field of views (i.e. the dark spots in Fig. 1), a total of 184 objects listed in the third catalog of Fermi-LAT sources [4] are found to reside. With the aim to compare the spectra measured by Fermi-LAT with the H.E.S.S. upper limits from the maps, an extrapolation of the former was carried out. At very high energies, the gamma-ray horizon becomes dramatically reduced due to absorption of these gamma-rays by the extragalactic background light (EBL), making source detection very challenging. In this energy domain, however, even upper-limits on the observed spectra - once this absorption effect has been corrected for - can be constraining, providing information about the nature of the sources intrinsic spectral emission.
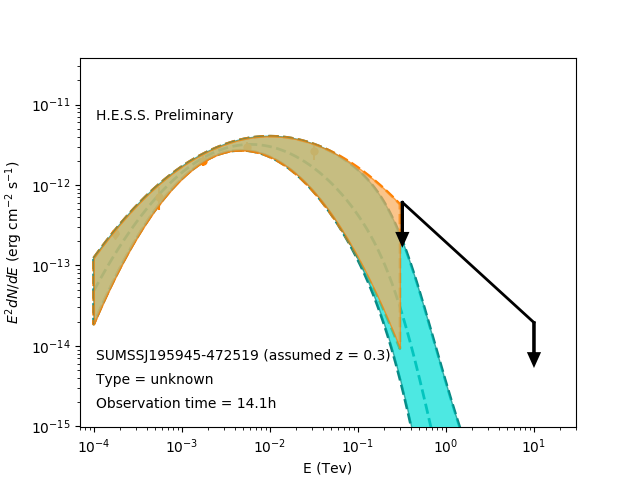
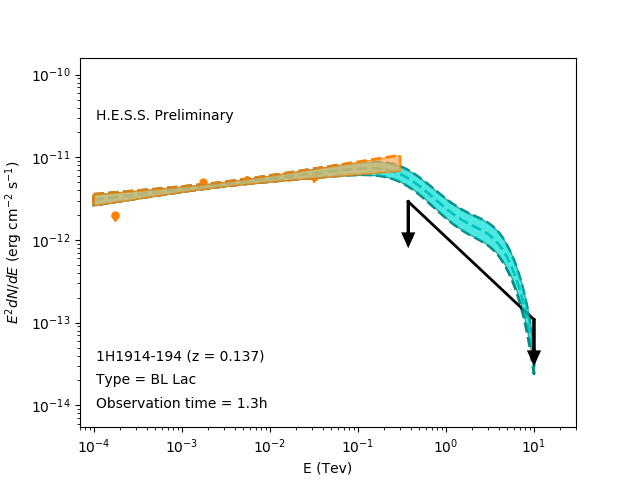
After correction for the EBL attenuation effect, using the model of [5], this extrapolation was compared with the upper limits derived. The top plot in Fig. 3 shows the energy spectrum of SUMSS J195945-472519 (again in observation cluster 7), for which the H.E.S.S. upper-limit obtained in the TeV range sits above the extrapolation from the Fermi spectrum. Since the redshift of this object is unknown, a value of 0.3 was assumed for the correction. In total, for 11 objects, the H.E.S.S. upper limit is found to be below the predicted flux, a result which implies that an intrinsic turnover of the spectrum must exists for these objects. An example of such a constrain can be found in the bottom plot of Fig. 3. Except for one object, all of them are relatively bright objects, and exhibit a hard spectrum in the Fermi-LAT band, which explains why the upper-limit set by our observations are constraining the flux in the TeV range.
The source catalog will be released in the near future, together with the maps derived from this important reanalysis of the H.E.S.S. extragalactic data.
References:
[1] H.E.S.S. Collaboration (H. Abdalla et al.), "The H.E.S.S. Galactic plane survey", Astron. Astrophys. 612 (2018) A1
[2] H.E.S.S. Collaboration (F.A. Aharonian et al.), "Discovery of VHE gamma rays from PKS 2005-489", Astron. Astrophys. 436 (2005) L17-L20
[3] H.E.S.S. Collaboration (A. Abramowski et al.), "Simultaneous multi-wavelength campaign on PKS 2005-489 in a high state", Astron. Astrophys. 533 (2011) A110
[4] The Fermi-LAT Collaboration, "Fermi Large Area Telescope Third Source Catalog", ApJS 218 (2015) 23
[5] A. Dominguez et al., "Extragalactic background light inferred from AEGIS galaxy-SED-type fractions", MNRAS 410, Issue 4, 2556-2578.