3C279 - the monster in Virgo is back!
January 2019
Happy New Year to all our readers!! To begin this 2019, the source of the month is dedicated to an old friend which has shown some very interesting behaviour in the past 2 years.
Back in the Summer of 2017 we were talking about the "devious" quasar 3C 279 (don't remember? Really?! Refresh your memory here). Well, the monster came back and it has behaved even more interestingly than before!
In short, this is one of the most famous quasars detected at gamma-ray energies, because of its high level of activity: it is one of the most luminous sources seen by the Fermi-LAT telescope. It is located at a cosmological redshift z = 0.536 [1], which means a distance of over 10 billion light years from us [2], in the direction of the Virgo constellation. This quasar is powered by the infall of matter onto a supermassive black hole with a mass of ∼109 solar masses [3], and consequently produces relativistic jets along the axis of the accretion disc which are aligned in our direction. Like a flashlight pointing towards us!
In the Summer of 2017, we were reporting about a strong flare that we detected with H.E.S.S. in 2015 in correspondence with a strong flux increase observed at lower gamma ray energies by the LAT instrument onboard the Fermi satellite. After this event, the source went into a period of low activity at gamma-ray energies. No t much was happening in that direction. This changed at the beginning of 2017. Suddenly, the "monster" had woken up again. Its flux at optical wavelengths was ∼20 times higher than usual. At the beginning of March 2017 the optical telescope ATOM (which sits next to the H.E.S.S. telescope in Namibia) observed a record breaking flux [4]. We had never seen such high flux in this waveband in 10 years of observation of this source!
To our surprise, the gamma-ray emission was quite low. There was some level of activity with some peaks, but not as violent as what was seen at lower energies.
These flares are often called "orphans" to indicate that they appear only in a certain wavelength band and not in others. It is still not clear why this is happening,
and possible explanations can involve multiple components responsible for the emission, geometrical factors, and absorption of radiation due to intervening material.
In this period, we have pointed the H.E.S.S. telescope several times at 3C 279 in the hope to catch a glimpse of very high energy emission in correspondence
with this interesting activity period. Unfortunately, constraints related to non-optimal observation conditions made it hard to observe at the right time:
on the day of the ATOM flux record, the presence of the full moon in the sky prevented our observations [5].
All our efforts ended up in non-detections (which it is still interesting and it can help to exclude explanations that would foresee such emission).
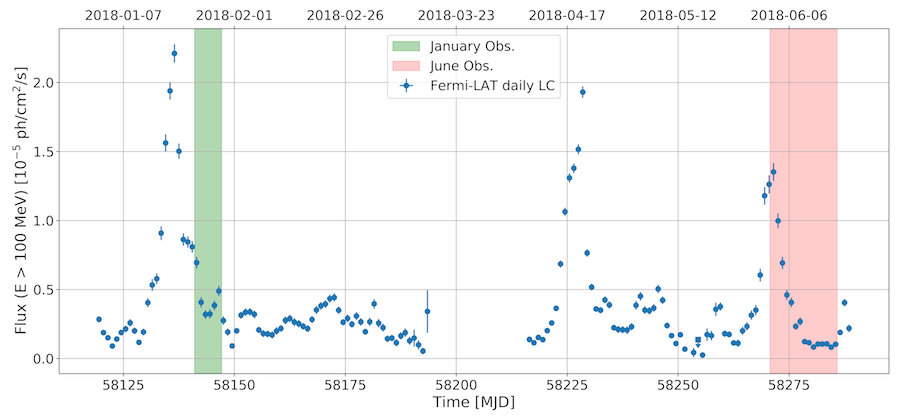
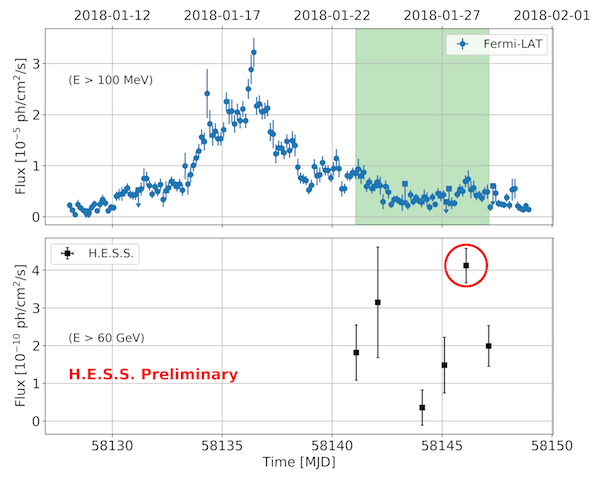
This partially unsuccessful set of observations got a whole different meaning when, in January 2018, 3C 279 became very bright at GeV [6] energies! The H.E.S.S. telescope immediately scheduled a follow-up, but several days of bad weather came and it was possible to observe only during the late decaying part of the "Fermi" flare (as visible from the green shaded area in Figure 1 and in more detail in the top panel of Figure 2). We had very little hope to see something, but our dataset appeared to be richer than we thought! Very well hidden, there is a small peak at the very end of the Fermi flare, where the data suggest an increasing contribution of higher energy photons to the flux of the source. The H.E.S.S. analysis shows a flare at energies above E > 60 GeV with a factor ∼4 increase in luminosity from one night to the other! This is the second flare detected by H.E.S.S. for this source (so far... see below!).
The source was sufficiently bright during the night of the flare that it was possible to derive a spectrum of the source above 60 GeV.
In the H.E.S.S. energy range, the event seems to be similar to the one of 2015, even though a complete analysis is still in progress.
The story is not really over yet. For the whole first half of 2018, 3C 279 was in great shape! As you can see from the plot above (Figure 1),
there was a second outburst again in April (that we could not observe) and a third one in June!
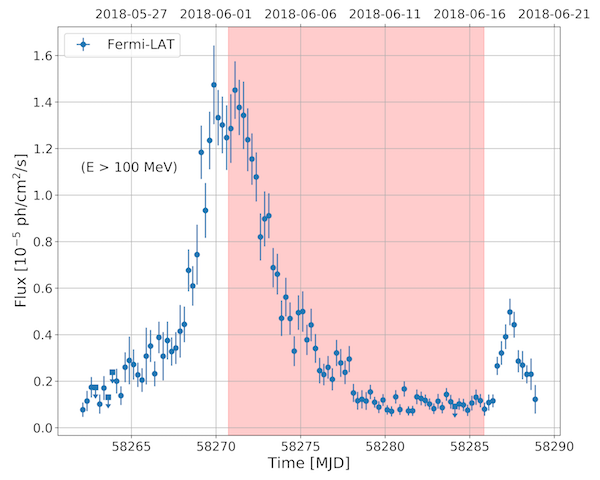
The June flare was our best shot at the source so far. The observations were able to start right after the peak of the flare (see light curve in the bottom
side of Figure 2) and it was possible to follow in detail the decaying part of the flare starting from the peak. R
emembering what happened in January, where the source was flaring at tens of GeV, right after the Fermi-LAT flare seemed to be over, we kept watching for as long as we could, t
ill the full Moon actually came to interrupt our monthly observation cycle (and life has a strange sense of humour: the GeV re-brightening was right after we had to stop observing).
We have observed the source with the full array, and beside the analysis of the MONO data (for the lowest energy threshold possible), we are working also on the data coming from the other smaller telescopes (for a full stereoscopic dataset). Since the STEREO analysis is more sensitive in the energy range of few hundreds of GeV [8], we expect to be able to extend our spectra to higher energies, allowing us to probe very interesting physics of quasars, like:
- internal absorption effects: due to the high luminosity in the core region of the source, gamma rays can be prevented from escaping the emission region [9]. Using this phenomenon and assuming reasonable models for the region near the central black hole, it is possible to constrain the position of the emission region with respect to the central black hole. This is particularly relevant, given that at the moment we still don't have a clear idea of where the gamma-rays are produced: if deep near the black hole or downstream along the jet. Our analysis on this source for the 2015 flare (and the preliminary one on the January 2018 one) seems to indicate that the emission has to be at least 1 light year away from the central black hole [10]. The June 2018 observations could be much more constraining.
- Extra-galactic Background Light (EBL) absorption: based on the same principle of the internal absorption, but now the photons that prevent the gamma rays from reaching us are those in the intergalactic medium, produced by stars and galaxies and accumulated over the entire history of the Universe [11].
Notes and References:
[1] The relativistic Doppler effect tells us that a receding object will appear redder, while an approaching one will appear bluer and the higher the relative velocity, the stronger the effect. Because of the expansion of the Universe, galaxies are receding from each other with the relative speed that increase with the distance. The redshift parameter quantifies how much "redder" they appear and hence it can be used to compute the cosmological distance of the object.
[2] Just to remind, one light year corresponds to 9.46 thousands billions of kilometres!
[3] Nillson et al., "The host galaxy of 3C 279", Astronomy and Astrophysics, Volume 505, Issue 2, 2009, pp.601-604
[4] http://www.astronomerstelegram.org/?read=10161
[5] Cherenkov telescopes like H.E.S.S. are delicate machines, the optical system uses optical units called photo-multipliers which are powered by high voltage. Their aim is to transform the dim Cherenkov light produced indirectly by the incoming gamma-ray photon into a measurable electric signal. The Moon is much brighter than the signal we want to measure and such high luminosity would induce a too strong current in the photo-sensors, with high risk of damaging them. That is why H.E.S.S. needs a moon-less sky to observe.
[6] GeV stands for one billion electronvolts (eV). Other units widely used in High Energy Astrophysics are also MeV and TeV: 1 million and 1 trillion eV, respectively (the prefixes follow the international system: k = 1000; M = 106; G = 109; T = 1012). The electronvolt is a unit of measurement of the energy particularly used in high energy astronomy. It is defined as the energy an electron can gain in a electric potential difference of 1 Volt. As an example, an optical photon has roughly the energy of 2 eV.
[7] The expression "detected with a significance of X standard deviations" (or X sigma) gives a proxy to evaluate the probability that the observed signal is originated by a statistical fluctuation of the background. The method is based on the integral of a Gaussian probability distribution. When something is 2 sigma significant, it means that there is a probability of ∼2.5% that the signal is due to a fluctuation (1-tail integral). In particle physics, a discovery can be claimed if the detection is above 5 sigma, which means a probability value for the fluctuation of ∼3×10⁻³ %.
[8] Observing in STEREO mode, with more than one telescope, allows a better rejection of the background, making possible the detection of more gamma rays. Because CT5 is much larger than the other telescopes, it is the only one which can go to the lowest energies (tens of GeV). The other 4 (smaller) telescopes have a minimum energy threshold above at least 100 GeV. This is why we can really benefit from the STEREO observation only in the energy range above hundreds of GeV.
[9] The general process is called "gamma-gamma" absorption. This is a quantum effect in which 2 photons interact with each other to produce a pair of electron-positron. There is a defined dependence between the product of the energy and the probability of the photons to interact. For our purpose here it is important to notice that photons with energy of ∼100 GeV (very high energy) interact quite well with ∼10 eV (ultra-violet) photons, which can be quite numerous in the central regions of quasars.
[10] C. Romoli, M. Zacharias, et al. for the H.E.S.S. Collaboration, "Observation of the extremely bright flare of the FSRQ 3C279 with H.E.S.S. II", Proc. ICRC (2017), available here (full paper in preparation).
[11] Fermi-LAT Collaboration, "A gamma-ray determination of the Universe's star formation history", Science (2018), Vol. 362, Issue 6418, pp. 1031-1034 (available also here here)