Searching for very-high-energy cosmic-ray electron sources
December 2018
Most TeV cosmic rays are believed to be produced in the Galaxy. In contrast to hadronic cosmic rays, cosmic ray electrons (CRE) propagating in the interstellar medium quickly lose their energy though synchrotron radiation in the μG Galactic magnetic field, and inverse Compton scattering off the low-energy photons of the interstellar radiation field. Thus, very-high-energy CREs that are detected near the Earth originate from local sources: TeV CREs are believed to be produced within about 1 kpc around the Sun. The immediate conclusion is that they arise from a handful of nearby sources. Depending on their propagation, the detection of an excess of CREs in specific directions of the sky could unveil the sources of very-high-energy CREs. Among the possible local emitters are sources such as Vela or Cygnus Loop, or a nearby dark matter clump. Dipole anisotropies in CRE arrival directions can be expected at the level of several percent in the case of a dominant source of the CREs in the GeV-TeV energy range [1]. For the dark matter dominated scenario for local CREs, a dipole anisotropy of 1% can be expected from a local dark matter subhalo [2].
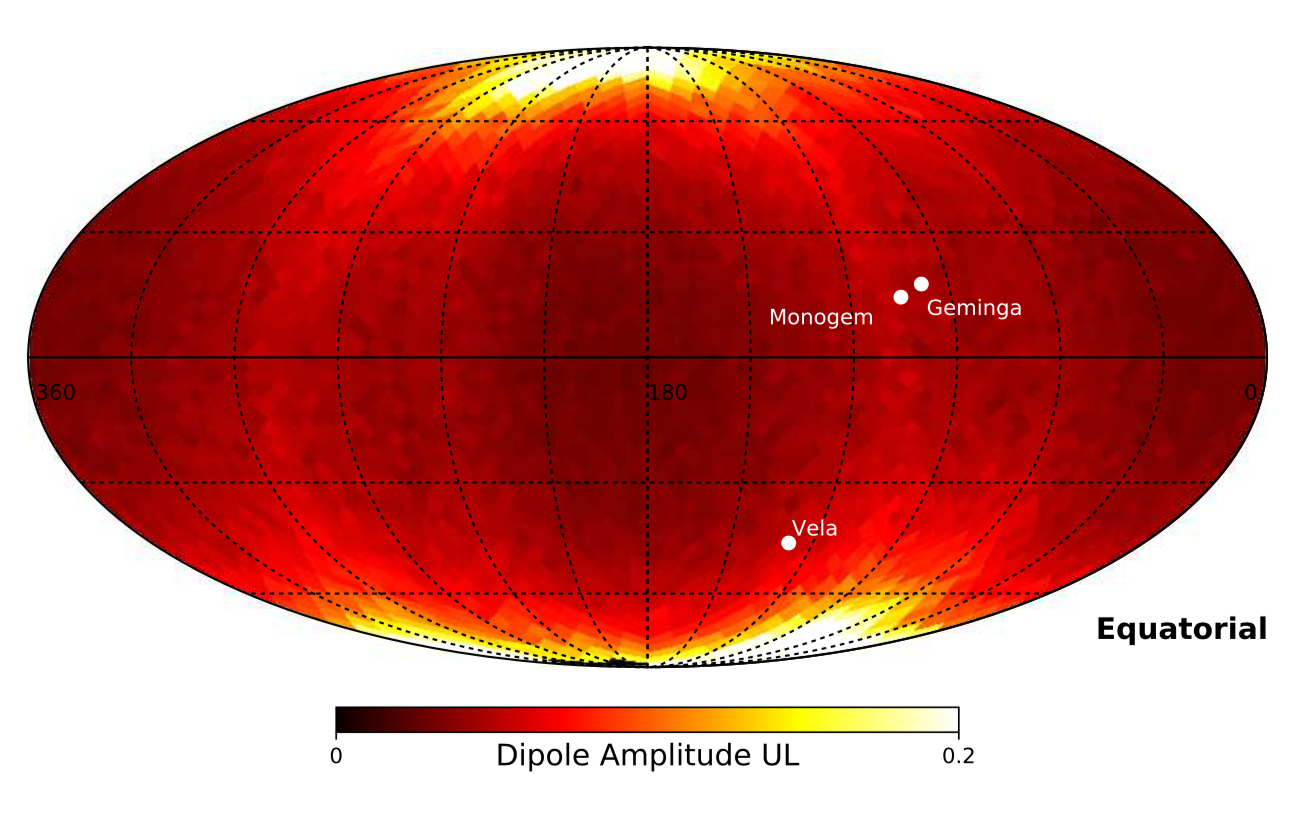
Only satellite experiments, such as PAMELA, Fermi-LAT and AMS-02, have so far published CRE anisotropy searches. While such searches are challenging for experiments with limited sky coverage, ground-based arrays of Imaging atmospheric Cherenkov telescopes (IACTs) have large collection area and relevant sensitivity in the TeV energy range. The electron identification and reconstruction have been successfully demonstrated by H.E.S.S. [3,4] through a careful control of the systematic uncertainties that may arise in such a measurement. The flux of CREs is being measured with an unprecedented precision by AMS-02 and CALET onboard the ISS, the Fermi-LAT instrument onboard the Fermi satellite, and IACTs such as H.E.S.S., MAGIC and VERITAS. Searches for potential anisotropies in the arrival directions of CREs make use of isotropic background maps to look for any possible departure from isotropy. The search carried out by H.E.S.S. is based on the generation of isotropic background maps from misidentified CR protons, and proceeds to a direct pixel-to-pixel comparison between the measured and background maps to look for any potential excess. Upper limits at the 95% C.L. on the dipole anisotropy amplitude are shown in Figure 1 and the method used to calculate these amplitudes is described below.
The H.E.S.S. dataset selected for CRE measurements consists of a total live time of 1250 hours from observations selected in extragalactic target fields with a total sky coverage of 0.8 sr. Galactic plane observations within 7° in Galactic latitudes are removed to avoid contamination of the Galactic diffuse emission, as well as regions within 0.4° of any known extragalactic sources. This guarantees that no leakage is expected in the CRE dataset since any VHE gamma ray is a potential background for such searches. In the selected gamma-ray-like event dataset, the discrimination between CREs and misidentified CR protons makes use of an event identification algorithm based on a boosted decision tree (BDT) classifier. This classifier quantifies the electron likeliness of every gamma-ray-like event. The training of the classifier is carried out from Monte Carlo electrons and protons simulated with CORSIKA [5].
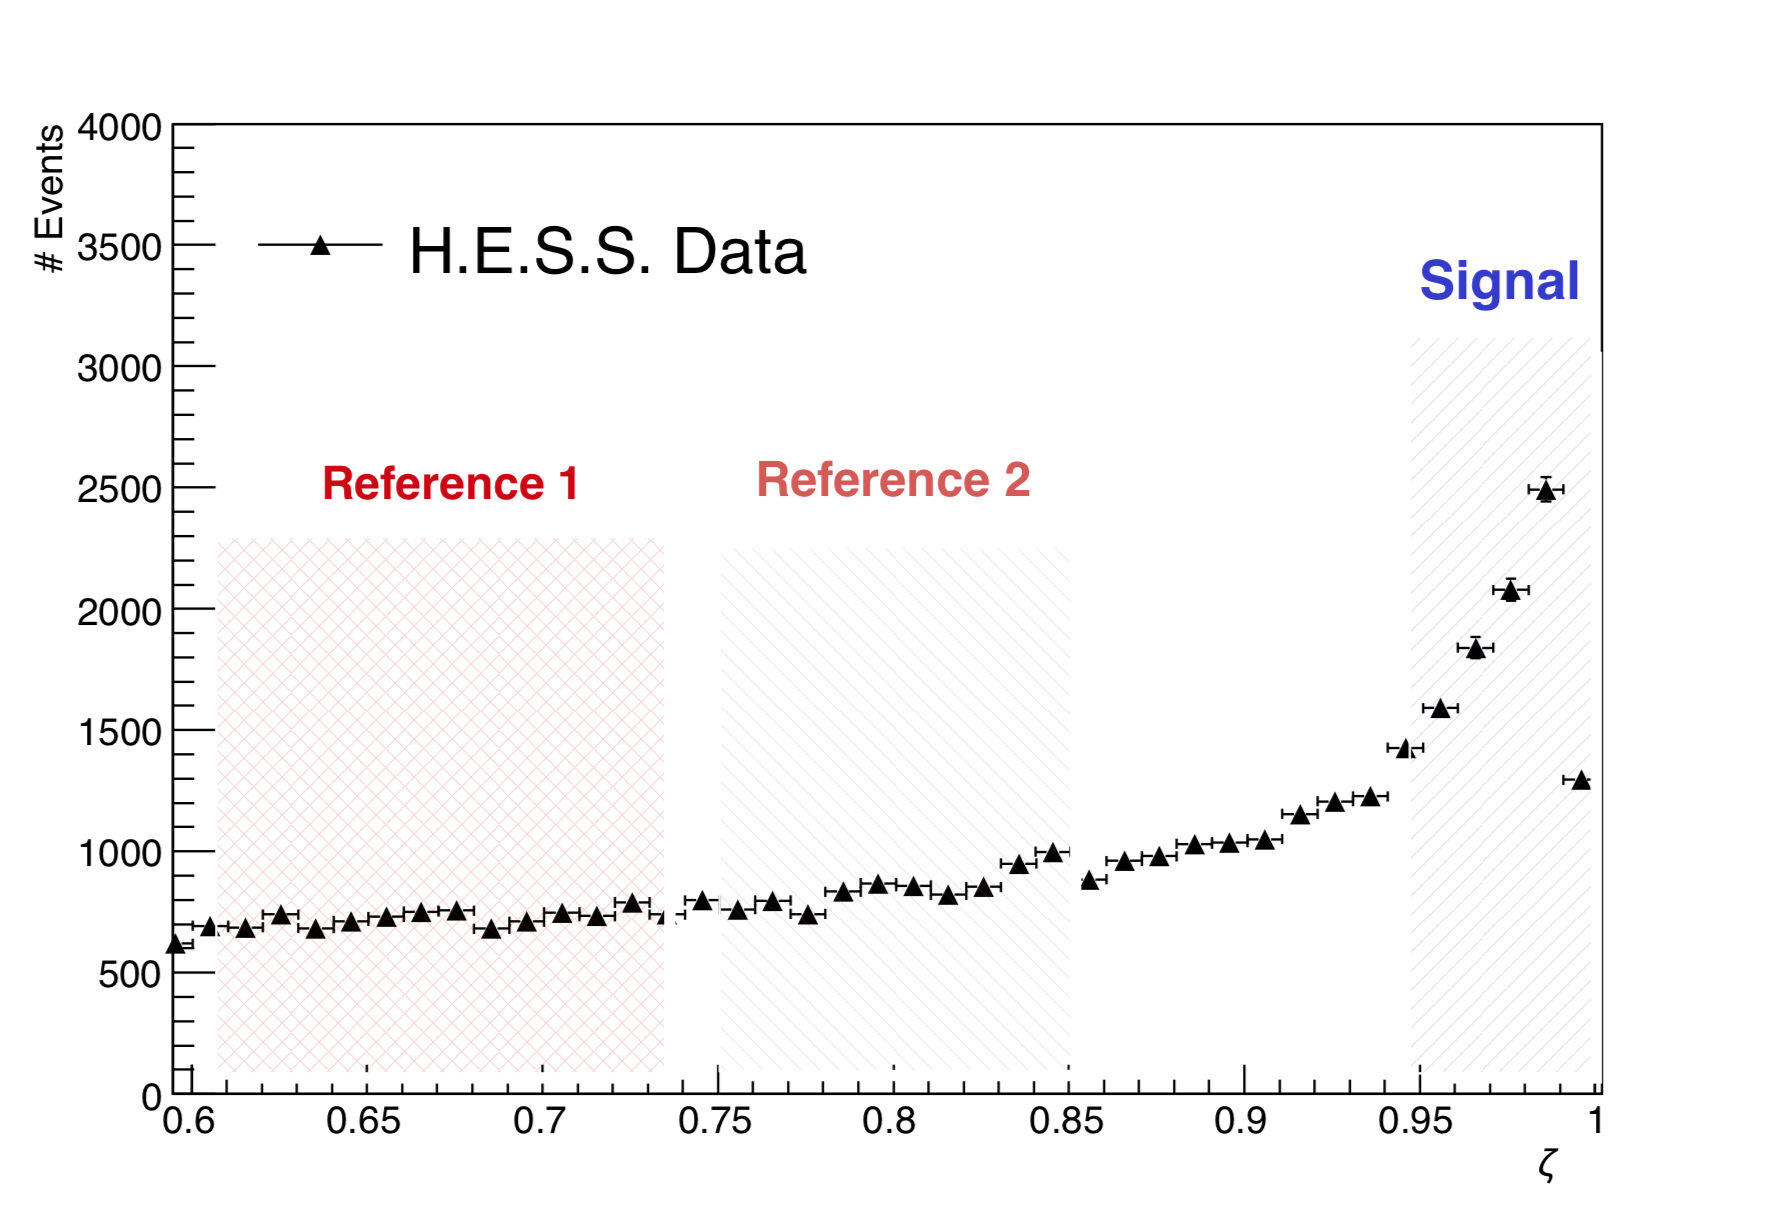
Events are then classified as signal- or background-like events in terms of their BDT score ζ [6]. The signal region dominated by electron events is defined for ζ-values higher than 0.95, while the background (reference) region is defined by a ζ-range with much lower values, and is thus dominated by protons. The bands in which the signal and background events are extracted from the data are shown in Figure 2. Sky directions are pixelised, and in each pixel the number of signal and background events can be determined. A direct pixel-to-pixel comparison of the signal and background sky maps is then carried out following Ref. [7]. No significant event excess between the signal and background maps is found and upper limit count maps are derived. The electron fraction in the signal and in the background regions is determined using a Monte Carlo electron and proton template fit to the data, and each pixel can be assigned with an electron fraction. The signal and reference maps are then integrated using a 90° circular kernels in order to search for a dipole anisotropy.
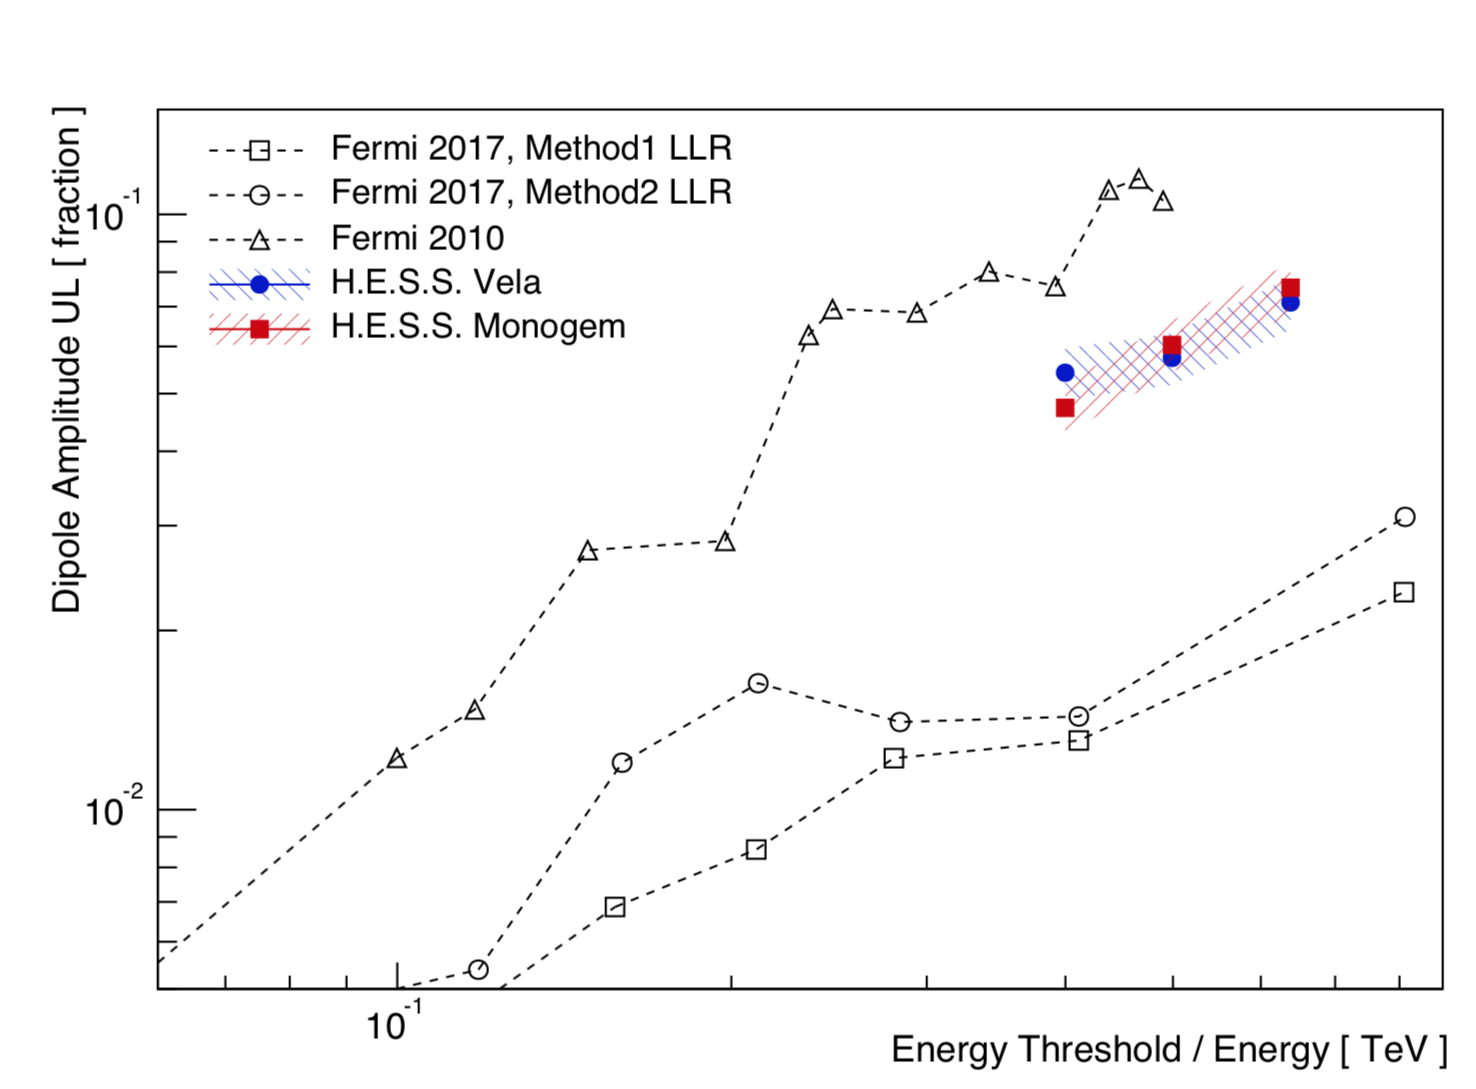
In order to compute upper limits on the dipole anisotropy amplitude, fake signal maps with given dipole amplitudes are generated to derive template-predicted signal maps that are then compared to the observed upper-limit signal excess maps. In case of a single-source scenario, the direction of the maximum amplitude is aligned with the direction of the source. The dipole amplitude upper limit is given by the highest amplitude that is compatible with the highest upper limit on the signal excess. Figure 1 shows a 95% C.L. sky map of the dipole anisotropy amplitude. Significant upper limits are obtained in specific regions of the sky. However, near the Poles, the upper limits are significantly deteriorated. The limits obtained in this study can be compared to Fermi-LAT results. In the direction of Vela/Monogem and Geminga, the H.E.S.S. limits reach about 5% for CRE energies above 400 GeV [6] in comparison to the 2-to-3% level limits obtained in the latest Fermi-LAT analysis [8] as shown in Figure 3. The limits obtained by H.E.S.S. provide strong constraints on anisotropy scenarios with a dominant source such as Vela or Cygnus Loop. This demonstrates the relevant input of IACTs to probe CRE anisotropy in the TeV energy range.
References:
[1] S. Manconi, M. Di Mauro, F. Donato, JCAP 1701 (2017) 006
[2] E. Borriello et al. Astropart. Phys. 35 (2012) 537
[3] F. Aharonian, et al. (H.E.S.S. Collaboration), Phys. Rev. Lett. 101 (2006) 261104
[4] F. Aharonian, et al.(H.E.S.S. Collaboration), A&A 508 (2009) 561
[5] D. Heck, J. Knapp, J. N. Capdevielle, G. Schatz, and T. Thouw, 1998, CORSIKA: a Monte Carlo code to simulate extensive air showers
[6] A. Abdallah, et al. (H.E.S.S. Collaboration), to be submitted
[7] M. Ackermann, et al. (Fermi-LAT Collaboration) Phys. Rev. D, 82, (2010) 092003
[8] S. Abdollahi, et al. (Fermi-LAT Collaboration), Phys. Rev. Lett. 118 (2017) 091103