H.E.S.S. observations of blazars within a new energy range
January 2017
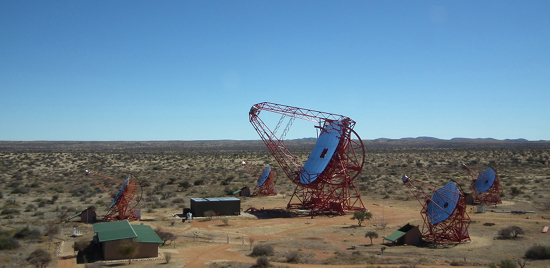
In 2012, the H.E.S.S. array initially consisting of four 12 m telescopes was upgraded to include an additional giant 28 m telescope at its centre. The addition of this new instrument, whose collection area is larger than all four of the other 12 m dishes combined, allows the instrument to lower the energy range of gamma-rays it can observe. This upgraded instrument, with the inclusion of the fifth large dish (see image on top), is known as 'H.E.S.S. II'.
During normal operation of H.E.S.S. II, all five telescopes point in the same direction and record stereoscopic images of gamma-ray air showers occurring in the atmosphere along the line of sight of the telescopes. Additionally, the CT5 telescope also records images of low-energy air showers which are too faint to trigger the 12 m telescopes (CT1-4). These monoscopic images from CT5 thus provide access to even lower energies than the stereoscopic data. A dedicated data analysis pipeline has been developed for the analysis of such monoscopic images.With the aim to test the new H.E.S.S. II instrument, observations of several different source classes have been made. In the extra-galactic sky, observations of the two bright blazars PKS 2155-304 and PG 1553+113 were carried out back in 2013 and 2014. These accretion powered blackhole systems, whose jets point towards us, are both well-known gamma-ray emitters, previously detected by H.E.S.S. and, at lower energies, by the Fermi satellite (see e.g. SOM Oct 2016). This new observational campaign served to demonstrate the successful operation of the new H.E.S.S. II instrument and provide new insights into the gamma-ray spectra of these two blazars within an energy range not previously accessible to H.E.S.S. With this end in mind, the data taken from CT5 were analysed using the monoscopic analysis method, i.e. separately from the data taken from CT1-4, allowing the spectrum of the two blazars to be reconstructed down into a new low-energy region. As a cross-check, the corresponding CT1-4 data were analysed using the legacy H.E.S.S. I analysis method, this time ignoring the data from CT5. A further cross-check of the results was provided through a comparison with the simultaneous gamma-ray observations made by the Fermi satellite. A comparison of the spectra obtained from the analysis of these CT5, CT1-4, and Fermi data sets are in Fig. 1. Very good agreement is found within the regions where overlap is present between the results of the different instruments.
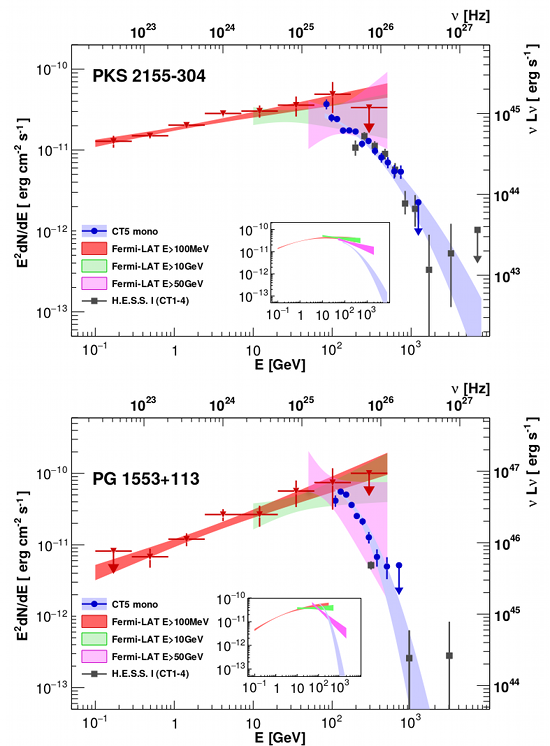
In terms of the blazars themselves, the observations revealed both objects to sit in quiescent states. No significant variability was found in the emission of PG 1553+113. However, mild fluctuations, at the level of 50%, were found in the brightness level of PKS 2155-304 on time scales from nights to months as well as in a comparison of the spectra between the 2013 and 2014 data sets. Although mild, such fluctuations enabled further cross-checks of the new instrument through their comparison to the fluctuations seen within the Fermi energy range. Interestingly, precisely the same level of fluctuations was seen by Fermi as well during the same period, further validating the robustness of the new system.
So why the interest in lowering the energy range? High energy gamma rays, once produced by their sources, are not free to travel unhindered through space, being instead impeded by the light from stars which has accumulated in extragalactic space over cosmic history. The optical photons of this extragalactic background light (EBL) present something of an obstacle to gamma-ray photons, since their collision may result in the production of an electron-positron pair. Such a process essentially marks the end of the gamma-ray's existence, and effectively sets a horizon beyond which gamma rays are unable to arrive to Earth before their demise. The specific energy of the optical photon most likely to produce this process depends on the gamma-ray's own energy. The lower in energy the gamma ray, the higher in energy the optical photon that is required. Thankfully, the abundance of optical photons decreases at higher energies, meaning that the horizon distance of low-energy gamma rays is significantly larger than that of their higher energy brethren. The addition of the large telescope at the centre of the H.E.S.S. array, which provides sensitivity to lower energy gamma rays, therefore allows H.E.S.S. to see a much larger Universe than had previously been accessible.
The spectra of the both PKS 2155-304 and PG 1553+113 are strongly affected in the H.E.S.S. energy range by this starlight attenuation. The attenuation is stronger for PG 1553+113 due to its larger distance from us, ~5 billion light years compared to "just" 1.5 billion light years for PKS 2155-304. Correcting the data for the expected attenuation reveals what the spectrum emitted by the sources looked like. Applying such corrections, the intrinsic spectra of the blazars is shown in Fig. 2 below. Using the combination of data from H.E.S.S. and Fermi, the intrinsic spectral energy distribution of PKS 2155-304 is found to be significantly curved, with the most powerful emission at a peak energy of about 10 GeV (Gigaelectronvolt). For PG 1553+113 only a mild curvature is found, suggesting that the peak of the intrinsic SED sits at an energy of ~500 GeV. However, once systematic uncertainties are taken into account, the intrinsic spectrum of PG 1553+113 was found to be consistent with no curvature. It therefore remains possible that the PG 1553+113 spectrum peaks at an even more extreme energy.

These results demonstrate for the first time the successful employment of the monoscopic data from the new H.E.S.S. II instrument (CT5) for blazar studies, marking a significant step forward in lowering the gamma-ray energy range that may be probed by H.E.S.S. This reduction in the energy threshold opens up the opportunity to probe new low-energy aspects about AGN fluxes, their variability, and their attenuation on the EBL out to larger distances (redshifts) than that probed previously by H.E.S.S.
Reference:
H.E.S.S. Collaboration & Fermi LAT Collaboration, Gamma-ray blazar
spectra with H.E.S.S. II mono analysis: the case of PKS 2155-304 and
PG 1553+113, accepted for publication in A&A, arXiv:1612.01843.