PKS 2155-304 - a Beethoven among blazars
October 2016
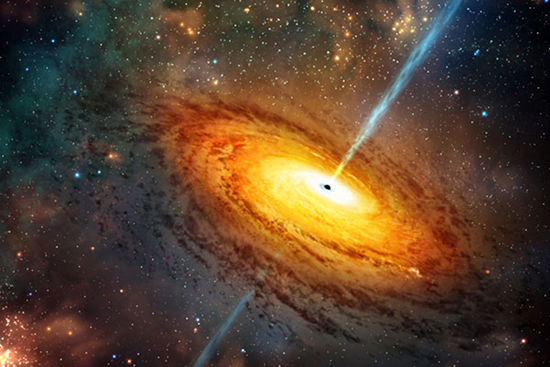
PKS 2155-304 is a famous object (already 3 SoM publications, did you miss them?) in the very high energy (VHE) and extragalactic domains. This popularity is well deserved since it is one of the brightest active galactic nuclei in the sky and the perfect archetype of its class of object. Active galactic nuclei (AGN) are giant luminous beasts and lie in the center of some galaxies, so bright that the AGN can outshine the luminosity of the rest of the galaxy. They are composed of a monster black hole (several billions of solar masses) which attracts all the surrounding matter and stars, creating an accretion disk around it. Some AGN, including PKS 2155-304, eject matter at speeds close to the speed of light, making what we call a relativistic jet. When the jet is closely aligned with the line of sight of the observer we call it a blazar, and what is observed becomes dominated by the relativistic effects of the jet. AGN were discovered approximately 50 years ago but a lot of mystery remains in this exciting field!
The VHE emission of this blazar has been discovered in 1999 by the Durham group [1]. Since then it has been monitored by a plethora of instruments at all wavelengths. As a Southern Hemisphere object, PKS 2155-304 is the perfect AGN to observe with the H.E.S.S. telescopes, allowing us to study in detail the long term behaviour of this blazar object.
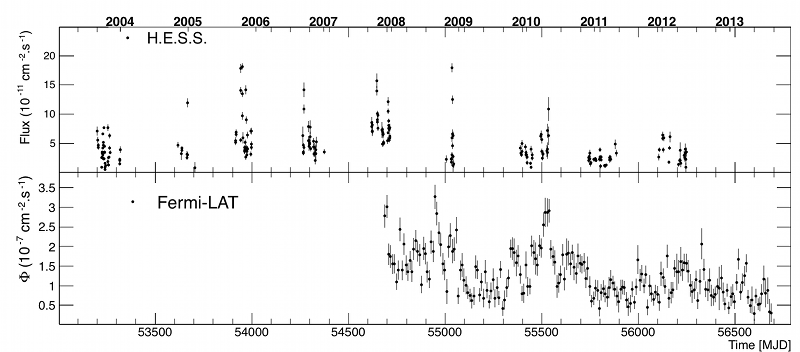
As this source has been monitored since the beginning of the experiment, the resulting dataset provides a unique opportunity for long term studies. From 2004 to 2012, we have collected around 330 hours of good data on PKS 2155-304 spread over 9 years, allowing us to build one of the longest long term VHE light curves (brightness evolution with time) of any AGN observed (Ref. [2] and Fig. 1).
One of the striking properties of blazars is their variability. The blazar's brightness can vary at all time scales, from minutes to days to months to years, with this behaviour being seen at all wavelengths, from radio to X-rays and gamma rays. VHE temporal studies on AGN are still relatively recent, with much about them remaining shrouded in mystery. Even if we have a lot of possible explanations, we are still unsure as to the true origin of their emission, and how this links to the central supermassive black hole, accretion disk, and relativistic jet. Concerning the origin of this emission, different processes using either accelerated electrons (leptonic models) or accelerated protons (hadronic models) can provide possible explanations. Currently, however, both model types can often explain AGN emission, with it remaining difficult to disentangle them. This is where variability enters in the game. Leptonic and hadronic models use different particles (the humble electron vs. the massive proton!) to explain the emission, hence their different characteristic times provide the possibility to differentiate variability signatures.
Better still, VHE experiments such as H.E.S.S. and Fermi-LAT (which collectively cover the behaviour of the source from GeV to TeV) have now accumulated enough data to provide us the chance to study temporal variability from small to long time scales. AGN light curves are generally characterized by power law noise [3], meaning that their power spectral density (PSD) follows the relation:
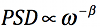
with ω being the frequency and β the power-law index (see here for more information on power law noise). The power spectral density represents the distribution of power at the various time scales of brightness variations observed. For instance, for white noise (β = 0), there is equal power in all timescales as there is no preferred timescale. Alternately, for periodic variations, the power peaks at the corresponding frequency and potentially at the harmonics. For AGN, instead of white we observe pink (β = 1) or red noise (β = 2) where there's more power at longer time scales. It is important to note that background noise can mimic real astronomical signal, making the distinction between real signal and background noise a real challenge.
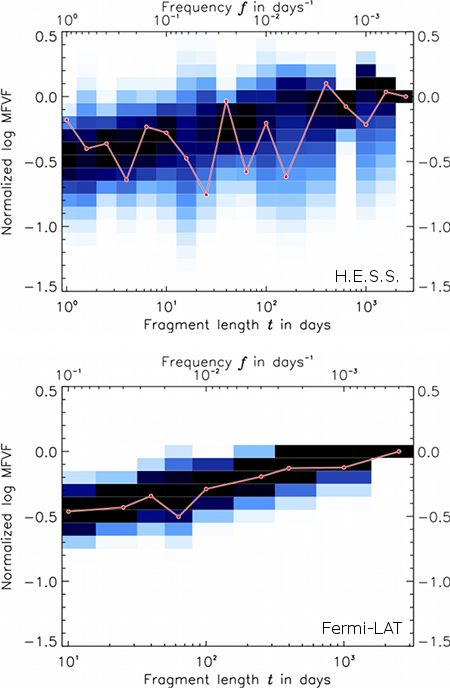
Here for the first time, we are able to probe long time scale light curves, over 9 years (but with holes in it, for which you can blame the Earth's rotation!) at VHE and more than 5 years at HE. The H.E.S.S. light curve is found to be characterized with an index of β = 1.10 and we find a similar value for the Fermi-LAT light curve with β = 1.20 as it is represented on Fig. 2.
So in both cases an index closer to 1 is found, looking more like pink noise (also called flicker noise) than the pure red noise which is apparently seen at shorter time scales: indeed, the big 2006 VHE flare of PKS 2155-304 (see the SOM 09/2007) showed an index around 2 on time scales from minutes to hours [4]. To put this result into perspective, we can compare it to other areas of scientific enquiry where such power-spectral slopes are obtained, namely fractals (self-similar structures). Spatial and temporal fractals, for example, can also be characterized by a power law PSD, with zoomed-in substructure being found to repeat the same pattern, in much the same way as that found in the above mentioned light curves. Interestingly, it was recently shown that music embodies such self-similar structure, with different composers found to prefer a particular β value. In this respect, PKS 2155-304 can be said to be the Beethoven of blazars since this composer also preferred β ~ 1!
Curiously, it also seems possible that the PSD of the emission exhibits a break at a characteristic time scale where the index changes from pink to red noise, being ~1 at low frequencies (long time scales) and ~2 at high frequencies (short time scales). The break seems to be around 1 day, and may be related to a change in the accretion flow conditions. Moreover, the similarity between the HE and VHE indices suggests that the emission is shaped by similar processes (so we see Beethoven-type structure at HE and VHE!).
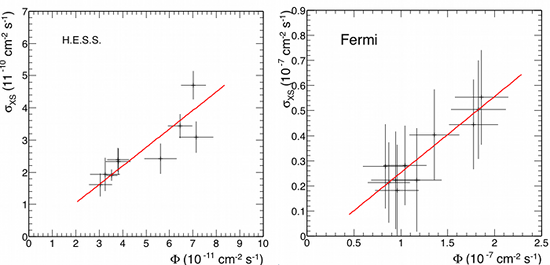
We also looked for the presence of log-normality in these light curves. Log-normality is simply when the distribution of the logarithm of some quantity follows a Gaussian distribution (but not the quantity itself). It means that instead of additive processes, multiplicative processes dominate the variability, so we should also see a correlation between the brightness (flux) and variability levels. This variability property has been previously seen in galactic binaries sources where it is believed to be linked to the underlying accretion process [5]. Here, to quantify the variability we use σXS which is just the variance of the flux. The 2006 flare of PKS 2155-304 already displayed this characteristic, so log-normality is seen even at small time scales, and in some other AGN, making it probably a general characteristic of AGN. It is also seen clearly in the long term light curves of PKS 2155-304. The log flux follows a nice Gaussian distribution, and the correlation between the variability and flux levels is evident as well (see Fig 3). So, as PKS 2155-304 gets brighter, it becomes more strongly variable.
So, the long term light curve of PKS 2155-304 exhibits a log-normal behavior, meaning the underlying processes are multiplicative. To illustrate this better, imagine the development of a particles shower in the atmosphere, a photon interacting with the atmosphere will produce two leptons, each of them will radiate a photon which will create two leptons and so on. Apparently a similar kind of behavior, but replacing the particles with fluctuations seems to shape the emission process within the source (fluctuations are creating fluctuations again and again). The simplest idea would be to assume that theses cascades are happening in the disk during the accretion process and that these density fluctuation are somehow being transmitted into the jet emission.
These results present an important step concerning long term variability of AGN. Now VHE and HE experiments are entering an age where we can begin to study their long term variability to improve our understanding of the physical processes driving blazar activity. The coming years will allow us to probe the question as to whether or not we see the same trend emerging between different blazar types as well as the origin of this emission.
References:
[1] Chadwick P.M. et al., Astrophys. J. 513, 161 (1999).
[2] H.E.S.S. Collaboration, H. Abdalla et al.,
Astron. Astrophys. (submitted).
[3] Lawrence, A. and Papadakis, I., Astrophys. J. 414, L85 (1993).
[4] Aharonian A. et al., Astrophys. J. 664, L71 (2007).
[5] Uttley, P. and McHardy, I., MNRAS 323, L26
(2001).