An extended source of TeV gamma rays towards the magnetar SGR1806-20
February 2012
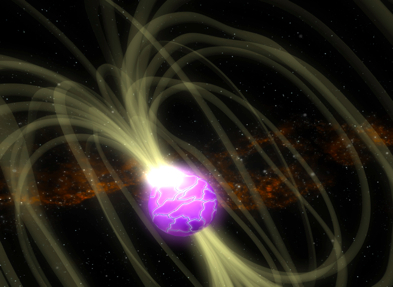
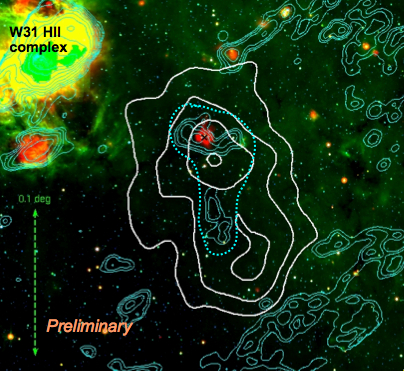
SGR 1806-20 is a magnetar, a neutron star with a surface field of 10^14 to 10^15 Gauss, orders of magnitude higher than for "ordinary" neutron stars. SGR 1806-20 is a "soft gamma repeater" (SGR), emitting bursts of gamma rays and X-rays at irregular intervals, presumably powered by the energy stored in the giant magnetic fields, released when the crust of the neutron star shifts and fields rearrange themselves, illustrated in Fig. 1. On December 27, 2004, the brightest flare ever detected from an object beyond the solar system was observed from SGR 1806-20, in the wavebands from radio to hard X-rays (see NASA release, and Hurley et al., 2005. SGR 1820-06 is most likely a member of the stellar cluster C1 1806-20, a stellar cluster harboring a number of extremely energetic massive stars such as the luminous blue variable star LBV 1806-20, which is more than a million times more luminous than the sun, and four Wulf-Rayet stars, which drive fast stellar winds which - upon colliding with each other or with the ambient interstellar medium - may set up shock zones in which particles are accelerated to high energies. Both SGR 1806−20 and C1 1806−20 are enveloped in a synchrotron radio nebula (G10.0−0.3, Kulkarni et al. 1994). Fig. 2 provides an infrared (SPITZER Space Telescope, see Wachter et al., 2007) and radio (VLA, Kim & Koo 2002) view of the region. In the radio image, the radio nebula G10.0-0.3 is visible. Alltogther, the region is an interesting candidate for very high energy gamma ray observations with the H.E.S.S. telescopes; it received over 80 h of exposure, distributed over the years from 2004 to 2010, both from the H.E.S.S. survey of the Milky Way and by dedicated pointings.
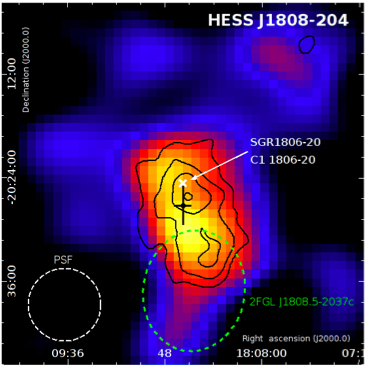
Indeed, an excess of very high energy gamma rays is observed from the direction of SGR 1806-20 and Cl 1806-20, see Fig. 3. The emission region is extended, corresponding to a total source size of tens of parsecs, roughly tracing the shape of the radio nebula G10.0-0.3. The gamma ray flux is a few percent of the flux of the Crab Nebula. The centroid of the emission region is slightly offset from SGR 1806-20 and C1 1806-20, but consistent within statistical errors (black cross in Fig. 3). As expected for such a huge emission region, within the large experimental errors the gamma ray flux is steady over the years 2004 to 2010.
Tracing the origin of the gamma ray emission to a specific object is not easy. The magnetic energy stored in the field of SGR 1806-20 would provide sufficient power to accelerate electrons and feed the large nebula: the gamma-ray luminosity is about 10^34 ergs/s whereas the energy dissipation in the magnetic field could be as high as 10^35 to 10^36 ergs/s. With their 10^38 ergs/s of kinetic energy, the stellar winds of the cluster stars provide an even more ample supply of energy.
Reference: "Discovery of steady and extended TeV gamma-ray emission towards the magnetar SGR1806-20 and stellar cluster C1 1806-20", H.E.S.S. collaboration, G. Rowell et al., at “Phases of Late Stage Stellar Evolution”, Macquarie Univ. Sydney 5-7 Dec. 2011