Gamma-ray emission from AP Librae
October 2011
The vast majority of very-high-energy gamma-ray-emitting active galaxies belong to the BL Lac class, itself subdivided into high-frequency, intermediate-frequency and low-frequency peaked BL Lacs (HBL, IBL, and LBL respectively) depending on the peak position of the synchrotron component in the spectral energy distribution (SED): in UV/X-rays for HBL, in the IR/UV range for IBL, and in the IR or lower for LBL. The very high energy gamma-ray emitters are mostly HBL, with AP Librae being only the third LBL seen by an atmospheric Cherenkov telescope after BL Lacertae (Albert et al., 2007) and S5 0716+714 (Anderhub et al., 2009). LBLs tend to have higher luminosities, are mostly found in radio surveys (while HBLs are mostly found in X-ray surveys), and might be a distinct class from HBLs though there could be a continuity between the LBL and HBL as suggested by the “blazar sequence” where the dominance of the high-energy component and its peak emission energy is anticorrelated with the total luminosity ( Fossati et al., 1998). The multiwavelength characterization of these blazars is of paramount importance for the development of models which explain the broad band emission, from millimeter to VHE energies, as originating from a dissipative region in a highly relativistic jet.
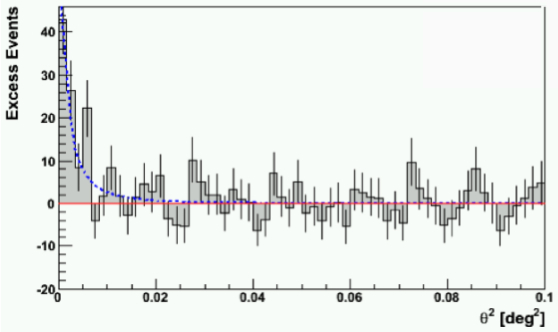
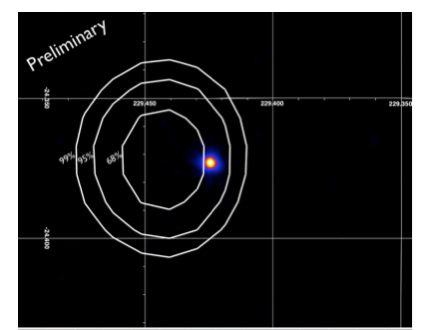
AP Librae was targeted for H.E.S.S. observations after it was reported in the Fermi Bright Source List (Abdo et al., 2009) with a hard photon index. The object was indeed detected at the 7σ level in 11 hours of exposure (see Fig. 1), as reported in ATel #2743. After the initial detection, the X-ray component was probed jointly by the Swift and RXTE instruments. Analysis of Fermi-LAT high-energy gamma-ray data showed no indication of variability of the source, and the full 25 months of Fermi-LAT data where hence used to derive a flux and spectrum. The X-ray sky map and the Fermi source location are shown in Fig. 2.
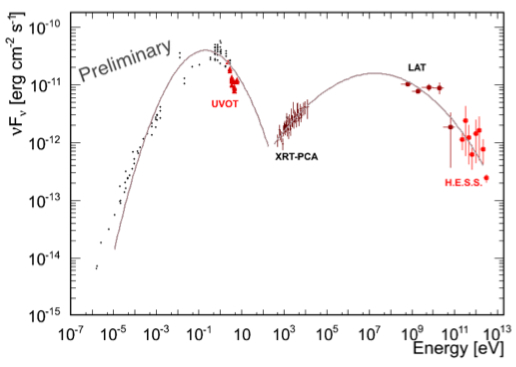
Fig. 3 shows the spectral energy distribution obtained from X-ray and Fermi and HESS gamma-ray data. One of the most striking features of the resulting SED, compared to other VHE gamma-ray emitting BL Lacs, is that the width of the high-energy component is extremely large, spanning over 33 octaves in energy, extending from ≃ 0.1 keV up to ∼ TeV energies. The SED shows a relatively narrow synchrotron component, peaked below 0.1 keV, which is quite remarkable compared to the above-mentioned VHE emitting other two LBLs, since the keV X-ray band is clearly still synchrotron radiation for both BL Lacertae and S5 0716+714. The (presumably) Inverse Compton component of Ap Librae spans the X-ray and Fermi and HESS gamma-ray range. AP Librae’s Compton distribution is probably the broadest seen in any TeV BL Lac. Such wide distributions pose serious challenges for synchrotron self-Compton type models; clearly, VHE γ-ray emitting LBL objects are unique objects which set new constraints on radiative emission models.
Reference: "Very High Energy gamma-ray emission from AP Lib detected by H.E.S.S.", W. Hofmann et al., Astronomer's Telegram #2743; and "Gamma-ray emission from AP Librae (PKS1514-241)", P. Fortin et al., on behalf of the Fermi-LAT and HESS collaborations, Proc. of the 25th Texas Symposium on Relativistic Astrophysics, December 06-10, 2010 Heidelberg, Germany; Proceedings of Science