Gamma-ray emission from the direction of the globular cluster Terzan 5
May 2011
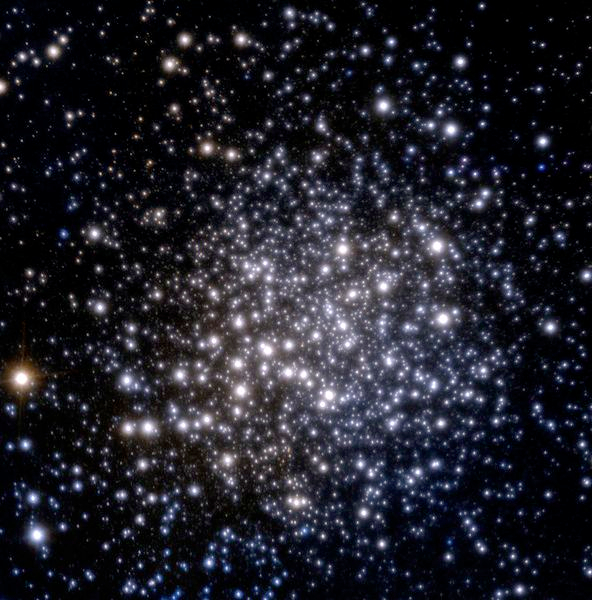
Globular clusters (GCs) are very old stellar systems with exceptionally high densities of stars in their cores, leading to numerous stellar collisions. GCs also contain many millisecond pulsars, which is likely related to the large fraction of binary systems. GCs are predicted to emit high-energy gamma rays, generated by energetic electrons accelerated in the huge fields near millisecond pulsars (Venter et al. 2009), or in the termination shocks of electron winds flowing away from the pulsars (Bednarek and Sitarek, 2007). Recently, the Fermi-LAT team indeed reported GeV gamma-ray emission from several GCs (e.g. Abdo et al. 2009, Abdo et al. 2010). With the largest population of identified radio millisecond pulsars, a very large core stellar density and the brightest GeV range flux as measured by Fermi-LAT, Terzan 5 (top image) stands out among Galactic GCs. Terzan 5 is located at a distance of about 6 kpc, about 1.7 degr. off the Galactic plane, a few degrees away from the Galactic center. The cluster is compact; half of its mass is contained within a fraction of an arcminute, and cluster gravity dominates within a tidal radius is about 5 arcminutes.
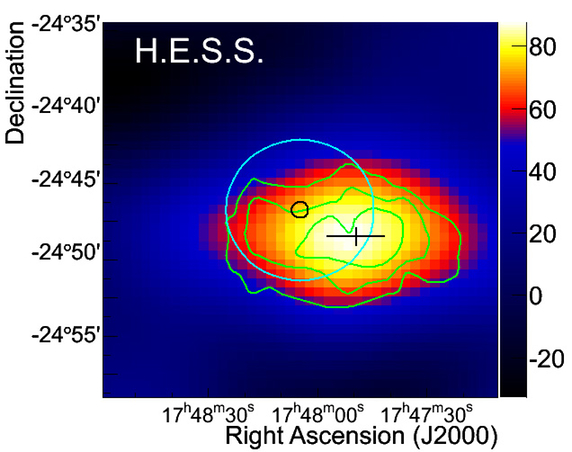
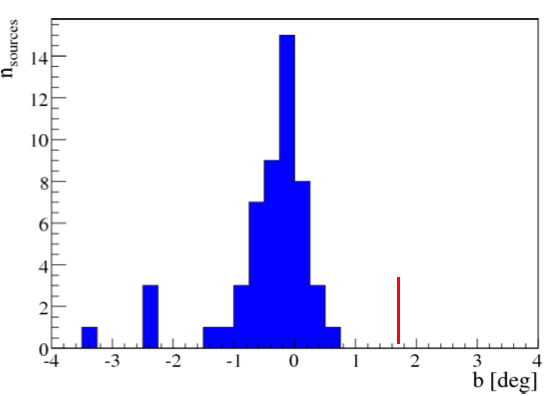
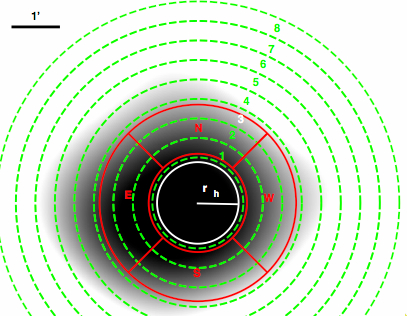
Terzan 5 was target of about 90 h of H.E.S.S. observations, initially as part of the Galactic plane survey, later from targeted observations. A very high energy gamma ray signal emerges in the Terzan 5 region, with a significance of over 7 standard deviations. Somewhat puzzling, however, the gamma ray source is elongated, and appears (marginally) offset by about 4 arcminutes from the center of the cluster (Fig. 1). Regarding the interpretation of these results, the obvious question is if the gamma-ray source is indeed related to Terzan 5, or represents a chance coincidence with a gamma-ray source - such as a pulsar wind nebula - along the line of sight. The probability of a change coincidence can be estimated from the observed density of gamma-ray sources, which cluster around the Galactic plane with a mean latitude of -0.3 degr. and a spread in latitude of about 0.4 degr (Fig. 2). At the +1.7 degr. latitude of Terzan 5, the probability of finding a chance coincidence is small, and estimated to about 0.01%. The models cited above can - with plausible parameters - account for the observed gamma-ray flux, but would predict point-like (Venter et al.) or slightly extended (2-3 arcminutes, Bednarek and Sitarek) emission centered on the cluster core. The observation of diffuse X-ray emission out to several arcminutes from the cluster independently hints the existance of high-energy particles on scales of the tidal radius; the X-ray emission is, however, more or less centered on the cluster ( Fig. 3, Eger et al. 2010).
In summary, the nature of the source is uncertain since no counterpart or model fully explain the observed morphology. It appears that the combined action of all pulsars in the core of Terzan 5 could produce the detected gamma-ray flux. However, the extension and in particular the indication of an offset of the source from the GC core challenge this interpretation.
Reference: "Very-high-energy gamma-ray emission from the direction of the Galactic globular cluster Terzan 5", H.E.S.S. collaboration, A. Abramowski et al., submitted for publication