The incredible shrinking source HESS J1303-631
January 2011
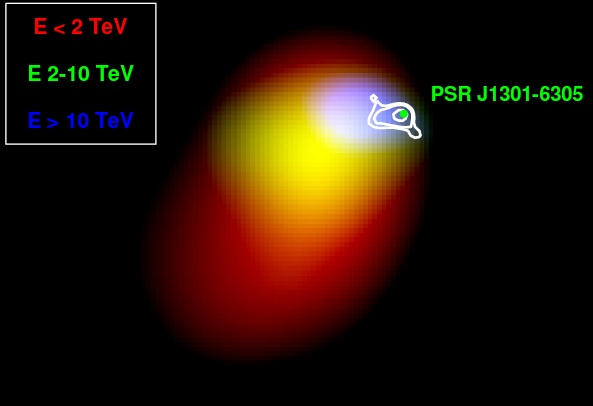
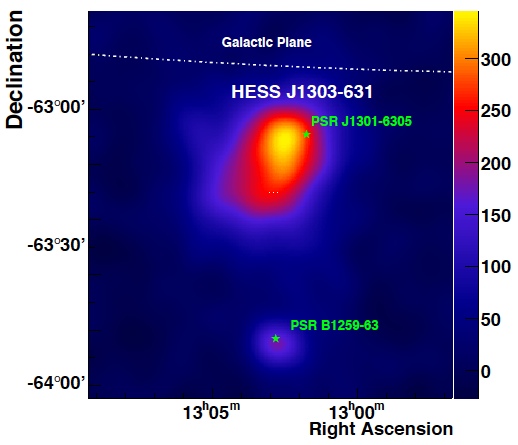
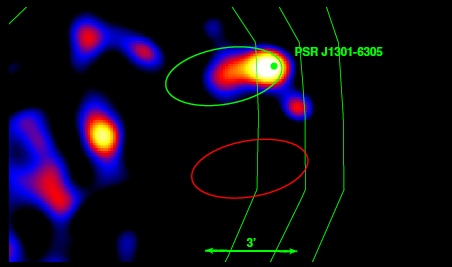
HESS J1303-631 was one of the first serendipitous discoveries in the early history of H.E.S.S.: the source appeared in the field of view of observations targeted at the binary pulsar PSR B1259-63 (SOM 5/2005). At the time, association with the pulsar PSR J1301-6305 was discussed, but was considered unlikely given that pulsar energetics were marginal to power the gamma ray emission. Also, the pulsar is quite offset from the center of the gamma ray source, see Fig. 1. Follow-up X-ray observations, however, showed no other plausible counterparts (Mukherjee & Halpern 2005). In the meantime, about two dozen very high energy gamma ray sources associated with pulsar wind nebulae became known, many of them with significant offset between pulsar and centroid of the extended gamma ray source. Further observations targeted either at PSR B1259-63 or both sources have since increased the dataset to 108 hours of good-quality data, motivating a new analysis. Fig. 1 shows the resulting sky map; as expected for an extended source, HESS J1303-631 is found to be steady from 2004 to 2008. What became evident with the enlarged data set is a change in source morphology with energy (top image and Fig. 2): with increasing energy the source size shrinks and the centroid shifts towards PSR J1301-6305. The intrinsic source size varies from 0.20+-0.01 degr. at low energy to 0.08+-0.02 degr. at the highest energy. A similar variation of morphology was so far only observed for the source HESS J1825-137 (Aharonian et al. 2006). The most obvious interpretation is that the source is indeed driven by the pulsar PSR J1301-6305, and that electrons radiatively cool as they propagate away from the pulsar, so that the highest-energy gamma rays are found near the pulsar, whereas the extended nebula is dominated by lower-energy particles. The origin of the asymmetry in electron propagation is most likely associated with the pulsar environment (see also SOM 9/2005). XMM X-ray observations of the field indeed reveal a X-ray pulsar wind nebula around the pulsar, extending asymmetrically roughly towards the gamma-ray source (Fig. 3). Detailed analysis of the X-ray data shows a roughly Gaussian core of 15" width slightly shifted (by about 6") from the pulsar, and an extended tail of 200" to 300" length.
Given that the estimate of the pulsar distance changed from the value of about 16 kpc originally assumed to a newer value of about 7 kpc, also from the energetics point of view the association of pulsar and gamma-ray source becomes more likely; the ratio of gamma-ray luminosity to the loss of rotational energy of the pulsar is in the same range as observed for other pulsar wind nebulae. A common fit of gamma-ray data, X-ray data and limits on radio emission shows that the energy flux in synchrotron radiation is about an order of magnitude below the flux in gamma rays which, if interpreted in a single-zone model, implies a rather low magnetic field in the emission region of about 1 microgauss. However, such a model is most likely oversimplified; in many other pulsar wind nebulae there are indications of a field decrease between the X-ray emission region and the gamma-ray emission region.
Reference: "H.E.S.S. Unidentified Gamma-ray Sources in a Pulsar Wind Nebula Scenario and HESS J1303-631", H.E.S.S. collaboration, M. Dalton et al. et al., Presentation at TeV Particle Astrophysics 2010, Paris