Vela X revisited
March 2010
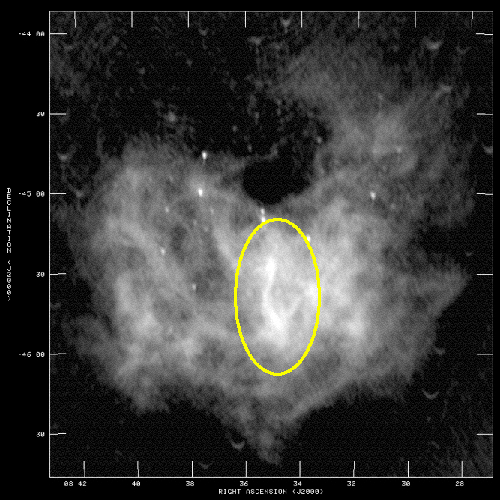
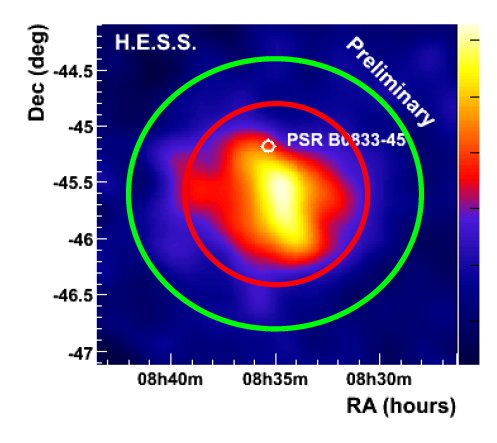
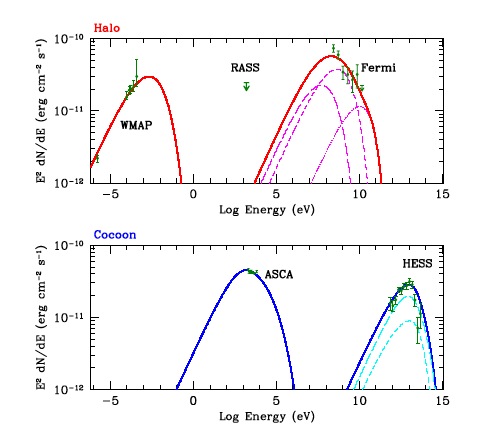
At a distance of about 290 pc, the Vela pulsar is one of the closest pulars. Emerging towards the south from the Vela pulsar is Vela-X - a nebular structure visible in radio (top image) in X-rays and in very high energy gamma rays (Fig. 1). Vela X - presumably the pulsar wind nebula driven by the Vela pulsar - is an unusual very high energy gamma ray source in that its spectrum is very hard, resulting in a peak in the spectral energy density around 10 TeV before the spectrum cuts off (see SOM 5/2006). The asymmetric shape of the Nebula, relative to the pulsar location, is thought to be related to interaction with the ambient medium and with the Vela supernova shell. The gamma-ray emission region is coincident with the so-called cocoon, much smaller than the extended radio emission region (see top image). The cocoon is also a source of X-ray emission. Explaining the wide-band emission in terms of a single population of electrons proved difficult: if the gamma-ray emission is identified as inverse Compton scattering by electrons accelerated in the vicinity of the Vela pulsar, these electrons naturally give rise to synchrotron emission in X-rays, but cannot easily account for the radio emission. The led de Jager et al. (2008) to postulate a second population of electrons, with lower energies, and more extended spatial distribution. Indeed, this prediction seems confirmed by the observation by the FERMI LAT and AGILE instruments of another component of gamma rays, peaking in the GeV energy domain (Fermi LAT Collaboration, 2010, see Fig. 2, and Pellizoni et al., 2010). Hence, one population of electrons seems responsible for the TeV gamma rays and the X-rays, the second population for the GeV gamma rays and the radio emission. The overall wide-band spectrum of Vela X hence shows peaks at radio wavelengths, in X-rays, in GeV gamma rays and in TeV gamma rays - a most unusual feature. The detailed shape of the GeV gamma ray emission region is difficult to determine, given the angular resolution of FERMI and AGILE; AGILE reports for the 0.1 - 3 GeV energy range a source which is consistent in size and shape with the H.E.S.S. TeV source, whereas the FERMI data in the 0.2 - 20 GeV energy range indicate a larger source, offset compared to the cocoon and roughly coincident with the right wing of the radio emission shown in the top figure. A larger spatial extent of the radio- and GeV gamma-ray emitting electrons is plausible, since their rate of energy loss should be reduced compared to highest energy electrons, and hence their reach is increased.
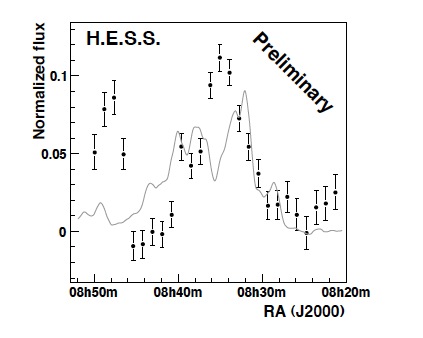
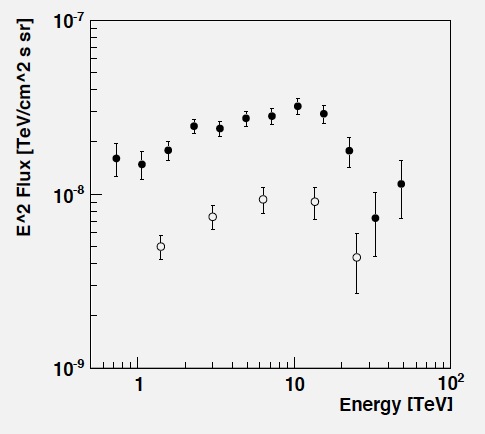
The original H.E.S.S. results (Aharonian et al., 2006) were based on 10 h of data and revealed an extended very high energy gamma ray source with a roughly elliptical intensity distribution, with an extent along the major axis of 0.48 degr., and along the minor axis of 0.36 degr., containing slightly over 2000 gamma rays. Since then, an additional 48 h of data were recorded. Analysis of these data reveal a significant level of gamma ray emission well beyond the radius of 0.8 degr. used as a source radius in the initial analysis. Within a ring of inner radius of 0.8 degr. and outer radius of 1.2 degr. around the source centroid (Fig. 1), very high energy gamma ray emission is detected with a significance exceeding 10 standard deviations. The morphology of the very high energy gamma ray emission, however, deviates significantly from the intensity distribution observed in radio (Fig. 3), demonstrating that these are indeed different populations of source particles. Somewhat surprisingly, the spectrum of gamma rays in the outer ring is more of less identical to that from the central source region, without indications of energy loss while particles propagate outward (Fig. 4). Explaining the detailed morphology and spectra of this complex object remains a challenge!
Reference: H.E.S.S. observations of the Vela X nebula, H.E.S.S. Collaboration, F. Dubois et al., Proceedings of the 31st ICRC, Lodz 2009