Another first from PKS 2155-304: a joint H.E.S.S. - Fermi campaign
February 2009
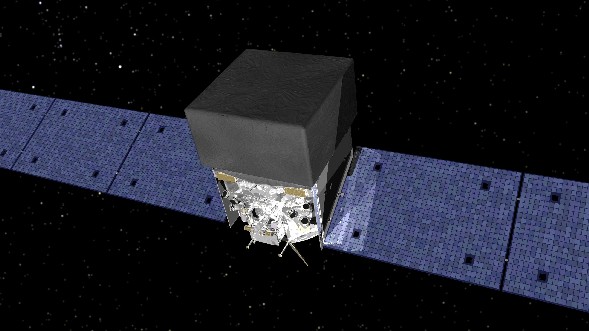
The Fermi Gamma-ray space telescope (see above), launched in the mid of last year, and ground-based Cherenkov telescopes ideally complement each other, together covering the energy band from tens of MeV to tens of TeV, enabling much more sophisticated probing of models for the process of particle acceleration and gamma-ray emission in cosmic sources, than possible with the more restricted energy band covered by each instrument alone. A first simultaneous observation campaign of the blazar PKS 2155-304 covering the optical, X-ray, high-energy (HE) and very high energy (VHE) band was carried out between August 25 and September 6, 2008 (MDJ 54704-54715), involving the ATOM optical telescope on the H.E.S.S. site (see SOM 3/2008), the RXTE and Swift X-ray satellites, Fermi (HE band), and the H.E.S.S. Cherenkov telescope array (VHE band). PKS 2155-304 is a most remarkable blazar source, exhibiting extremely rapid variability, outshining during burst peaks the Crab Nebula by a factor of 10 and more (SOM 9/2007); it was among the first sources detected by H.E.S.S. (SOM 11/2004).
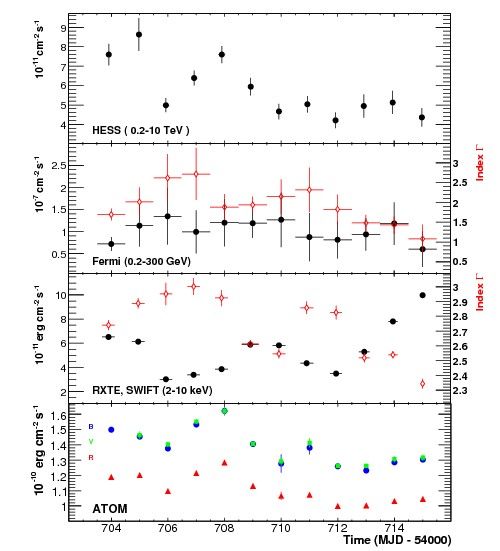
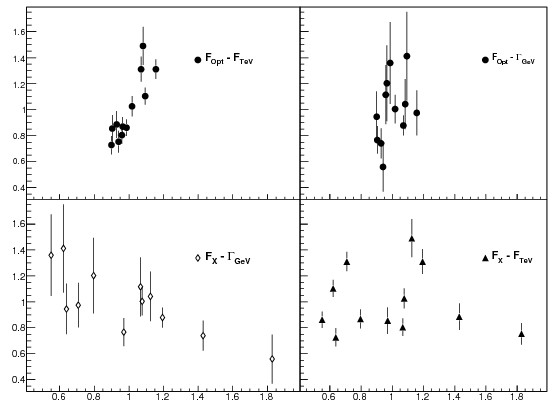
Light curves measured during the 12-day campaign in the four energy bands are shown in Fig. 1. Significant variability of the blazar is seen in the VHE gamma-ray band and in the X-ray and optical bands; however, the overall flux level at VHE energies is modest, not too far from the level considered as the steady "ground state" of the source. For the HE band and the X-ray band, also the spectral index is shown, characterizing the variation of emission with energy within a band. In the VHE band, no variation in the spectrum of gamma rays was observed during the campaign. A rather complex pattern of correlations between the emission in different energy bands is obvious and is further illustrated in Fig. 2: surprisingly, there is little correlation between the X-ray and VHE gamma-ray emission, contrary to what is observed for many other blazars. On the other hand, a correlation emerges between the optical band and the VHE band, and a hint of an (anti-)correlation is seen between X-ray flux and the spectral index of HE spectra, with HE spectra becoming harder with increasing X-ray flux.
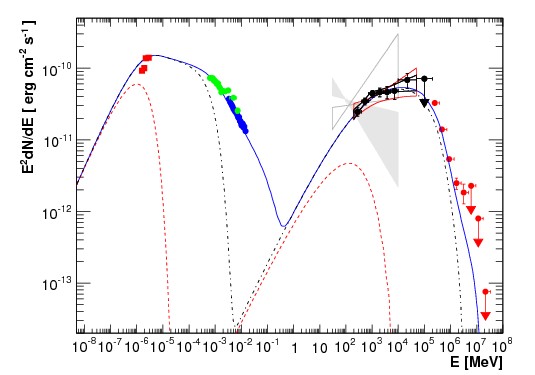
The broad-band energy spectrum of the source is displayed in Fig. 3, demonstrating the seamless energy coverage achieved by the combination of Fermi and H.E.S.S., and showing two distinct components peaking near the optical and at the upper end of the HE range, respectively. Almost exactly between the Fermi and H.E.S.S. energy domains, a pronounced break in the spectrum is visible. The solid line shows a synchrotron self-Compton model calculation, where a population of electrons emits synchrotron radiation in the radio to X-ray domain, this radiation then being upscattered by the same electrons, providing the HE and VHE emission. While this model does reproduce the shape of the spectra, it cannot, however, easily reproduce the observed pattern of correlations between energy bands, which does, for example, indicate that VHE gamma-rays and optical photons are linked via a common population of parent particles.
The first simultaneous campaign between Fermi and H.E.S.S. illustrates the power of combining such instruments; many more examples will certainly follow over the next years.
Reference: "Simultaneous observations of PKS 2155-304 with H.E.S.S., Fermi, RXTE and ATOM: spectral energy distributions and variability in a low state", H.E.S.S. Collaboration (F. Aharonian et al.) and Fermi-LAT Collaboration (A. Abdo et al.), submitted for publication, and presented e.g. at the 213th meeting of the AAS, Long Beach, CA, January 4-8, 2009.