Cosmic Ray Electrons Measured with H.E.S.S.
December 2008
Very high energy cosmic-ray electrons represent an interesting diagnostic concerning sources of high-energy particles. At TeV energies, electrons lose their energy on time scales of 100000 years due to synchrotron radiation in interstellar magnetic fields. This limits their reach to a kpc or less, implying that sources of very high energy electrons must be nearby; a possible source could be the Vela supernova remnant at about 250 pc distance (see top image) (Kobayashi et al. 2004) or nearby pulsars (e.g. Hooper et al. 2008). Cosmic-ray electrons (and positrons) can also be used to probe annihilation of dark matter particles, predicted to result in an enhancement in specific energy ranges, as recently observed at energies up to 100 GeV by PAMELA (Adriani et al. 2008) and around 300-800 GeV by ATIC (Chang et al. 2008).
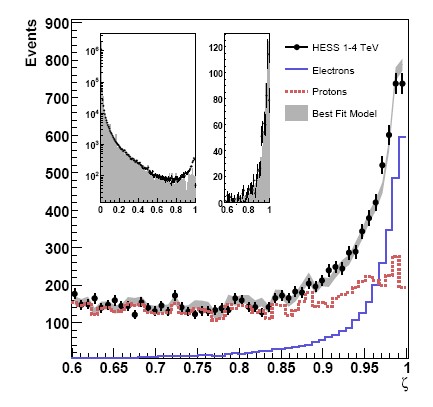
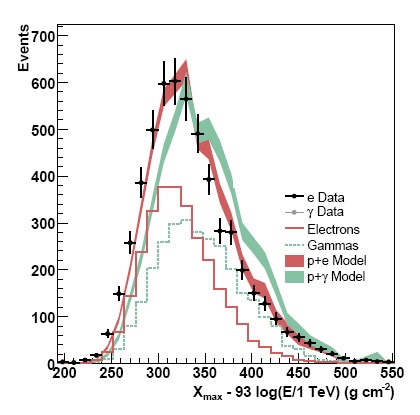
Cosmic-ray electrons have so far been measured using satellite- or balloon-based instruments such as AMS, PAMELA, ATIC or BETS (see e.g. here for more references), allowing the reduction of the overwhelming cosmic-ray background by tracking the particles and their interactions in a calorimeter. Given the steeply falling electron spectrum and the limited detection rates, such instruments run out of statistics at energies of a few 100 GeV to a TeV, just in the region where propagation losses are expected to cause a cutoff for distant sources, and where contributions from nearby sources might create a specific signature (Kobayashi et al. 2004). Imaging atmospheric Cherenkov telescopes detect electrons at an abundant rate; the challenge here is to separate them from the background of nuclear cosmic rays, lacking a directional signature such as employed for gamma-ray sources. A specific classification algorithm - the "Random Forest" - has now been shown to provide sufficient separation power (Fig. 1): the algorithm classifies events with a "zeta" variable between 0 (nuclear cosmic ray showers) and 1 (electromagnetic showers induced by gamma rays or electrons). The distribution in zeta for observations of regions without known gamma-ray sources results in a zeta distribution where a clear peak at zeta=1 sits on a flat background which is well modeled by cosmic-ray simulations. A hint as to whether these excess electromagnetic showers are caused by gamma rays or electrons can be obtained by looking at the height ("Xmax") where the air shower is most intense: since a gamma ray first needs to convert into an electron-positron pair, electron-induced air showers develop a bit higher up in the atmosphere. Indeed, the observed shower heights favor electrons (or positrons) as the source of these showers (Fig. 2).
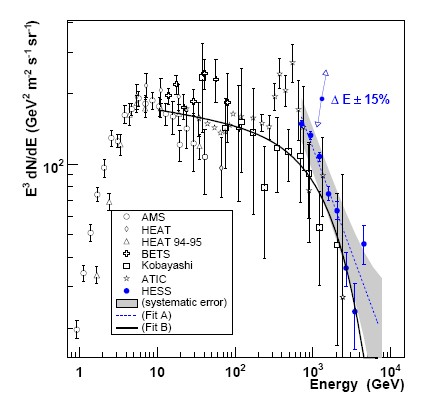
The electron spectrum measured for energies around and above 1 TeV by counting such events falls off significantly faster with energy than the spectrum at lower energies (Fig. 3), for the first time giving clear evidence for the expected break in the spectrum, lacking indications for a strong nearby source of multi-TeV electrons. These results demonstrate the power of Cherenkov instruments in measuring the spectrum of cosmic-ray electrons. The work presented here concentrates on the cutoff region of the electron spectrum; in view of the recent PAMELA and ATIC results, it will of course be highly interesting trying to push this technique to lower energies, covering the region of the ATIC signal (see e.g. Hall and Hooper, 2008).
Reference: The energy spectrum of cosmic-ray electrons at TeV energies", H.E.S.S. collaboration, F. Aharonian et al., Phys. Rev. Lett. in press, and arXiv:0811.3894
BETS, Kobayashi and ATIC. See here for references.