Probing Extragalactic Background Light with 1ES 0229+200
November 2007
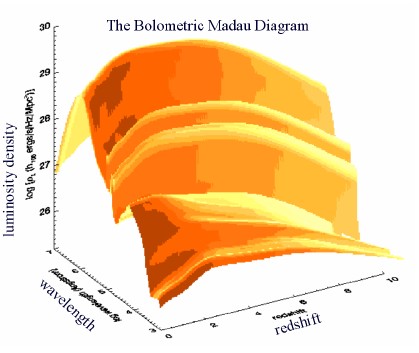
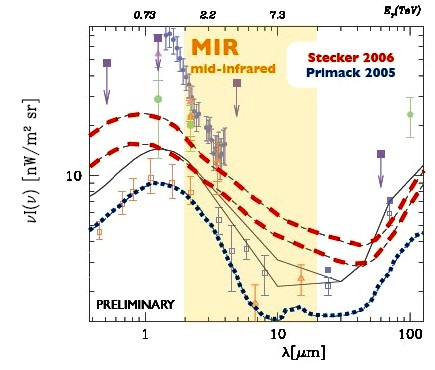
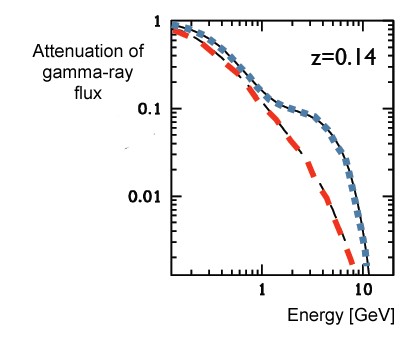
Gamma traveling from extragalactic sources to Earth are attenuated by interactions with extragalactic background light (EBL), due to creation of electron-positron pairs in collisions between gamma rays and EBL photons. This attenuation offers a way of determining EBL intensity, bypassing the main problem of direct measurements, namely the subtraction of the overwhelming local light sources. The EBL intensity traces the star formation history of the Universe (see top panel) (for reviews see e.g. Primack et al. 2005, Stecker 2006). The EBL spectral distribution is characterized by a peak at micrometer wavelengths, representing direct emission from stars, and a second peak in the far infrared, beyond 100 micrometers, due to emission from dust (Fig. 1). Between the two peaks is a more or less pronounced intensity dip. Model predictions differ in this region; the models of Primack et al. (2005) (blue dotted lines) exhibit a sharp drop in the mid-infrared (MIR), whereas models of Stecker et al. (2006) show a smoother decay (red dashed lines), with emission by warm dust and by hydrocarbon molecules and silicates partly filling the dip. These differences translate into differences in the energy-dependent attenuation of very high energy gamma rays (Fig. 2): at energies of a few TeV, absorption is dominated by mid-infrared EBL photons. A spectral distribution which drops like 1/wavelength results in energy-independent, i.e. constant, attenuation, creating a characteristic spectral "shoulder" (blue dotted lines in Fig. 2). A less drastic variation of EBL with wavelength results in a continuous steepening of gamma-ray spectra due to EBL absorption (red dashed lines).
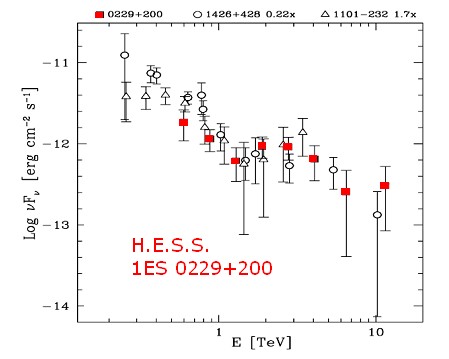
In 70 hours of H.E.S.S. data taken in 2005 and 2006, a clear signal was detected from the blazar 1ES 0229+200, at a redshift of z=0.14, corresponding to a flux of about 2% of that of the Crab Nebula. What makes this observation particularly interesting is that the source exhibits a rather hard gamma-ray spectrum, with a spectral index of 2.5, with a hint of a flattening of the spectrum around energies of a few TeV (Fig. 3). Though statistically not very significant, indications of similar spectral features are seen in other blazars at redshift z>0.1 (Fig. 3). The hard spectrum constrains the shape of the EBL in the mid-infrared: assuming that the intrinsic gamma-ray spectra produced by blazars have a spectral index of 1.5 or larger, EBL spectra with significant energy in the mid-infrared and with corresponding strongly energy-dependent attenuation would steepen gamma-ray spectra beyond the observed index of 2.5 and are excluded, favoring EBL models with a pronounced mid-infrared dip. As emphasized by Stecker and Scully 2007, this conclusion depends, however, on the assumption concerning the intrinsic blazar spectrum. If 1ES 0229+200 produces gamma-rays with a spectral index of 1 to 1.5, as Stecker et al. (2007) predict for relativistic shock acceleration scenarios, but so far not observed for any of the nearby VHE blazars, the higher mid-infrared EBL can be accommodated. Either of these two explanations of the observed hard spectrum make 1ES 0229+200 a very interesting VHE gamma-ray source!
References:
New constraints on the Mid-IR
EBL from the HESS discovery of VHE gamma rays from 1ES 0229+200
Aharonian et al.,
Astronomy & Astrophysics, in press