Auxiliary Information for results for the paper "Revealing X-ray and gamma ray temporal and spectral similarities in the GRB 190829A afterglow” (H.E.S.S. Collaboration, Science 2021)
Main paper
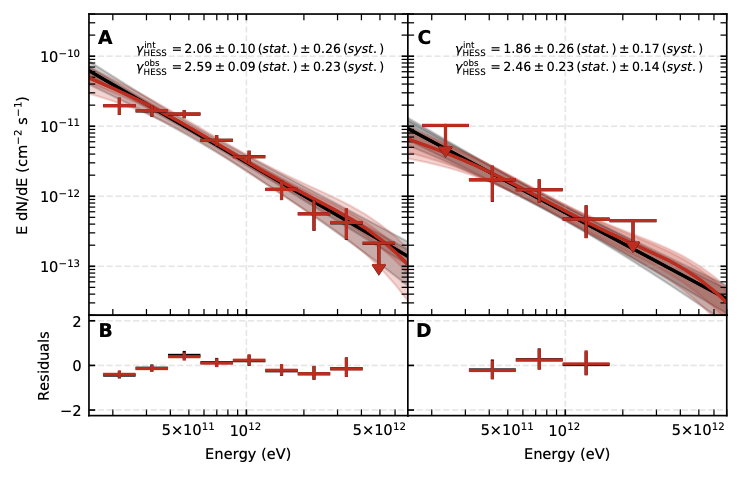
Figure 1: H.E.S.S. VHE spectra of GRB 190829A on the first and second nights.
Left plot, i.e. first night of H.E.S.S. observations
Data points:
ECSV format (incl. additional information; can be used as input for astropy/gammapy/etc.)
| E [TeV] |
dNdE [1/(cm^2 s TeV)] |
dNdE_err_pos [1/(cm^2 s TeV)] |
dNdE_err_neg [1/(cm^2 s TeV)] |
residuals |
res_err_pos |
res_err_neg |
| 0.216 |
9.074e-11 |
2.731e-11 |
2.389e-11 |
-0.435 |
0.149 |
0.170 |
| 0.320 |
5.165e-11 |
9.990e-12 |
8.954e-12 |
-0.126 |
0.152 |
0.169 |
| 0.473 |
3.151e-11 |
4.371e-12 |
4.016e-12 |
0.450 |
0.185 |
0.201 |
| 0.699 |
8.998e-12 |
1.690e-12 |
1.500e-12 |
0.126 |
0.188 |
0.211 |
| 1.033 |
3.563e-12 |
7.707e-13 |
6.801e-13 |
0.212 |
0.231 |
0.262 |
| 1.528 |
8.216e-13 |
2.938e-13 |
2.430e-13 |
-0.241 |
0.225 |
0.272 |
| 2.258 |
2.485e-13 |
1.385e-13 |
1.065e-13 |
-0.375 |
0.268 |
0.348 |
| 3.338 |
1.248e-13 |
7.421e-14 |
5.324e-14 |
-0.148 |
0.364 |
0.507 |
| 4.935 |
4.298e-14 (U.L.) |
- |
- |
- |
- |
- |
Right plot, i.e. second night of H.E.S.S. observations
Data points:
ECSV format (incl. additional information; can be used as input for astropy/gammapy/etc.)
| E [TeV] |
dNdE [1/(cm^2 s TeV)] |
dNdE_err_pos [1/(cm^2 s TeV)] |
dNdE_err_neg [1/(cm^2 s TeV)] |
residuals |
res_err_pos |
res_err_neg |
| 0.236 |
1.692e-11 (U.L.) |
- |
- |
- |
- |
- |
| 0.415 |
4.122e-12 |
2.422e-12 |
2.122e-12 |
-0.202 |
0.411 |
0.469 |
| 0.731 |
1.697e-12 |
6.879e-13 |
5.904e-13 |
0.255 |
0.437 |
0.509 |
| 1.286 |
3.675e-13 |
2.101e-13 |
1.706e-13 |
0.038 |
0.482 |
0.594 |
| 2.262 |
1.979e-13 (U.L.) |
- |
- |
- |
- |
- |
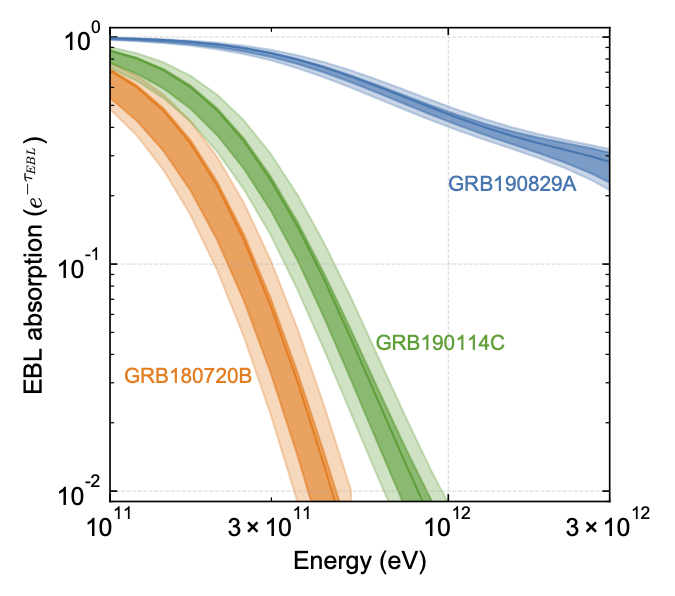
Figure 2: Extragalactic background light absorption for three GRBs detected at VHE
Package containing the tabulated EBL values and a Jupyter notebook to create the figure can be found the following archive;
Fig2_EBL.zip
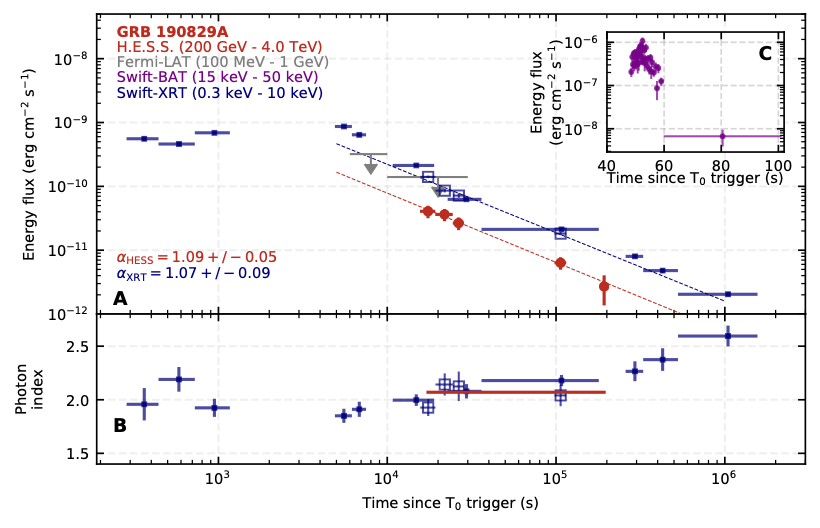
Figure 3: Logarithmic X-ray and gamma-ray Multi-wavelength energy flux light-curves of the GRB 190829A afterglow.
The details of the H.E.S.S. light-curve are given in the paper in Table S2, those of Swift-XRT in Table S4.
The following package contains the data files and a python script to reproduce the figure:
Fig3_lightcurve.tar.gz
| Interval |
Time after T0 [s] |
Energy flux [10^-11 erg / (cm s)] |
stat. uncert. [10^-11 erg / (cm s)] |
sys. uncert. [10^-11 erg / (cm s)] |
| Night 1, cluster 1 |
1.56e4 - 1.92e4 |
4.06 |
0.65 |
0.90 |
| Night 1, cluster 2 |
1.92e4 - 2.44e4 |
3.57 |
0.42 |
0.77 |
| Night 1, cluster 3 |
2.44e4 - 2.85e4 |
2.66 |
0.39 |
0.60 |
| Night 2 |
9.79e4 - 1.15e5 |
0.64 |
0.14 |
0.14 |
| Night 3 |
1.84e5 - 2.01e5 |
0.27 |
0.13 |
0.07 |
The
code used for the MCMC fitting of the datasets used in the paper is available in the following archive:
Modelling_GRB190829A.tar.gz
For a detailed description, usage instructions, etc. we point towards the README.md file contained in the package. It also contains all necessary experimental data (including the butterflies in Figure 4) and a Juyter notebook reproducing the figures of the paper. The output of the MCMC chains used for the figures in the paper can be found
here.
The MCMC code is also available from
Github.
Supplementary Material
Figure S1: Significance skymap of the H.E.S.S. observations
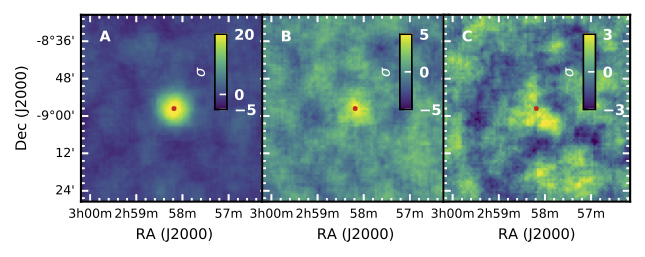
The following package contains the FITs file of the maps and a python script to reproduce the figure:
FigS1_skymaps.tar.gz
Swift-XRT results
This archive,
XRT_data_files.tar.gz, contains the files to recreate the time-sliced XRT analyses in this paper. The results are provided in Tables S3 and S4, and plotted in Figs. 3, 4, S4, and S5. The files ’timeslices_tableS3.txt’ and ’timeslices_tableS4.txt’ correspond to the time intervals described in Tables S3 and S4, respectively, and were uploaded to
https://www.swift.ac.uk/xrt_spectra/addspec.php?targ=00922968 to build the time-sliced spectra. Note that the BAT trigger time (which is what the XRT uses) is 51.5 seconds after the GBM one, and the times listed in Tables S3 and S4 are calculated from the GBM trigger time (T0 in the paper).
Collaboration Acknowledgement
The support of the Namibian authorities and of the University of Namibia in facilitating the construction and operation of H.E.S.S. is gratefully acknowledged, as is the support by the German Ministry for Education and Research (BMBF), the Max Planck Society, the German Research Foundation (DFG), the Helmholtz Association, the Alexander von Humboldt Foundation, the French Ministry of Higher Education, Research and Innovation, the Centre National de la Recherche Scientifique (CNRS/IN2P3 and CNRS/INSU), the Commissariat à l'énergie atomique et aux énergies alternatives (CEA), the U.K. Science and Technology Facilities Council (STFC), the Knut and Alice Wallenberg Foundation, the National Science Centre, Poland grant no. 2016/22/M/ST9/00382, the South African Department of Science and Technology and National Research Foundation, the University of Namibia, the National Commission on Research, Science & Technology of Namibia (NCRST), the Austrian Federal Ministry of Education, Science and Research and the Austrian Science Fund (FWF), the Australian Research Council (ARC), the Japan Society for the Promotion of Science and by the University of Amsterdam. We appreciate the excellent work of the technical support staff in Berlin, Zeuthen, Heidelberg, Palaiseau, Paris, Saclay, Tübingen and in Namibia in the construction and operation of the equipment. This work benefited from services provided by the H.E.S.S. Virtual Organisation, supported by the national resource providers of the EGI Federation.