 [PDF], [FITS]
Significance map after model fit:
 [PDF], [Model]
 Link to the paper:
https://doi.org/10.1051/0004-6361/202245776
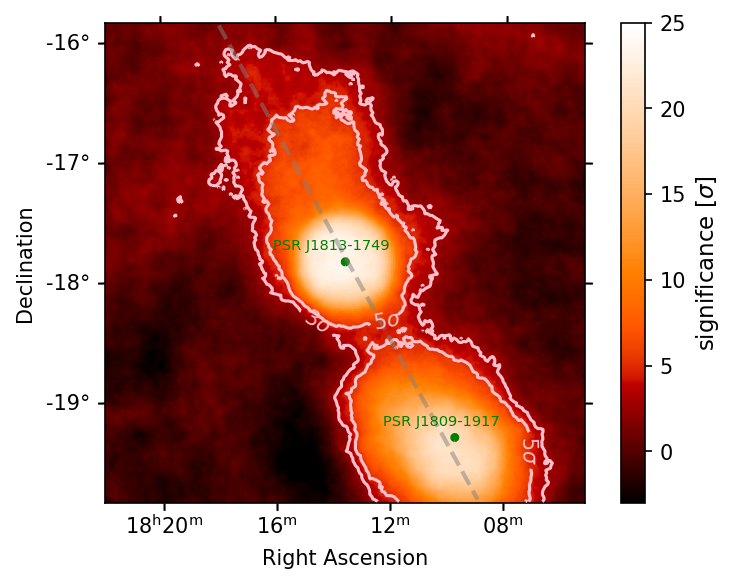
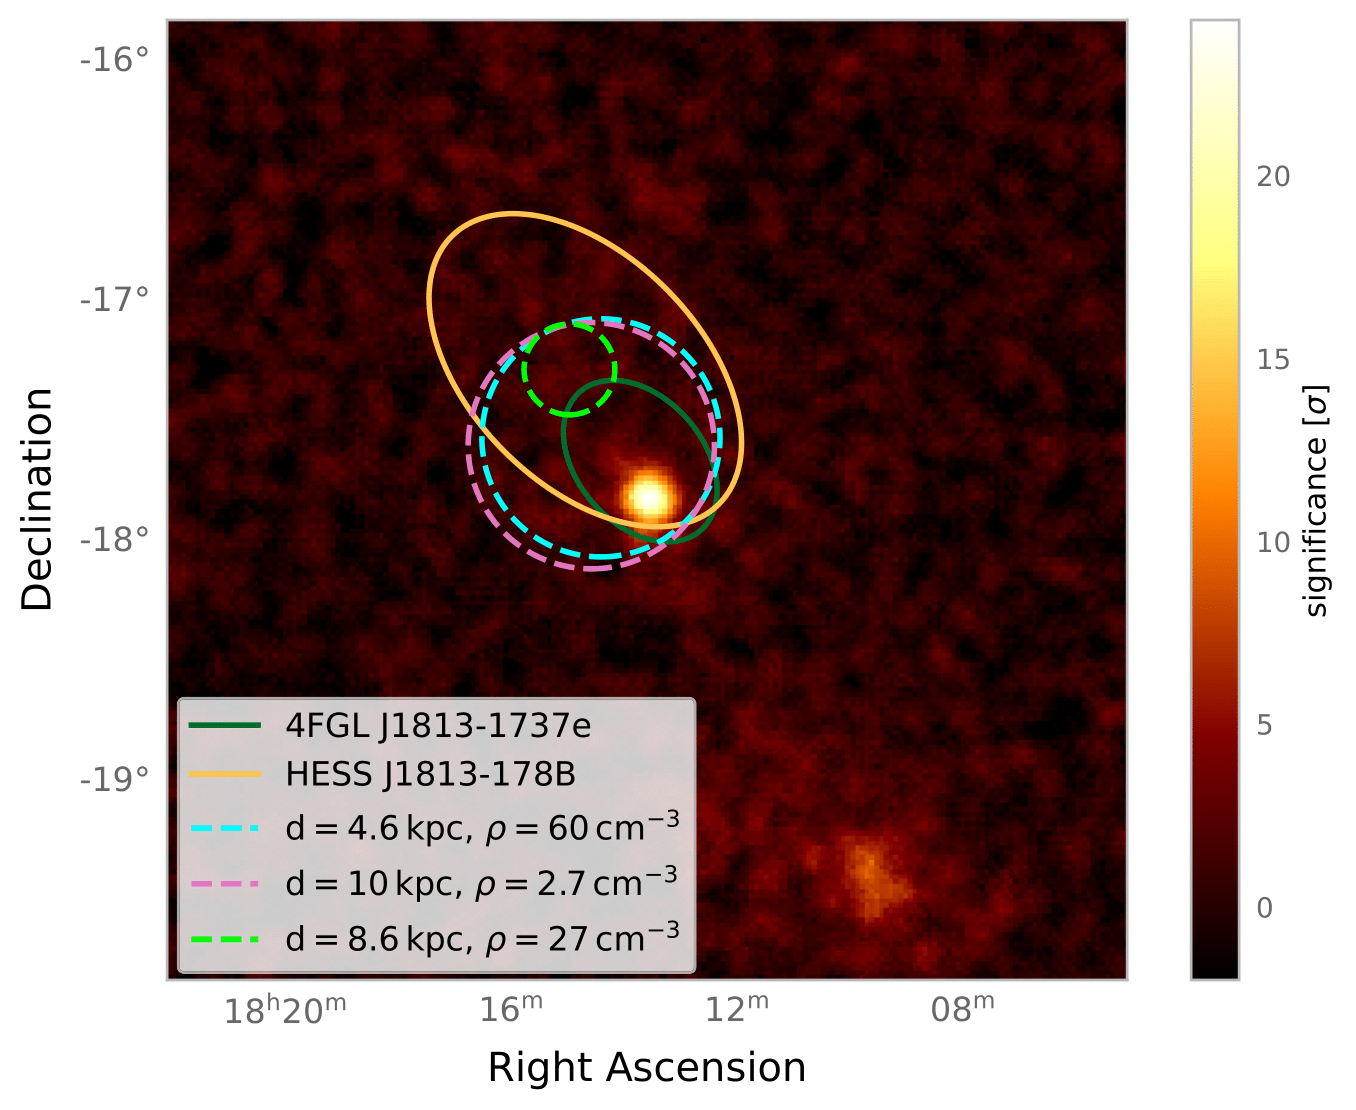
Figure 1:
Significance map:
[PDF], [FITS]
Significance map after model fit:
[PDF], [Model]
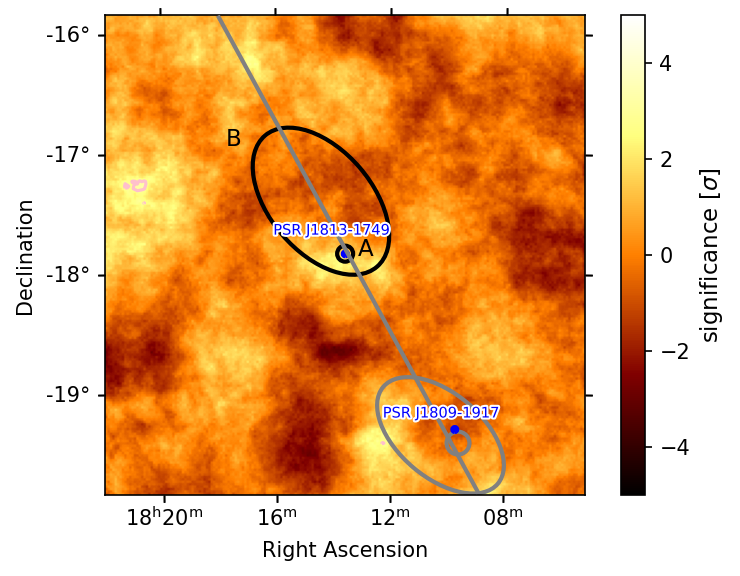
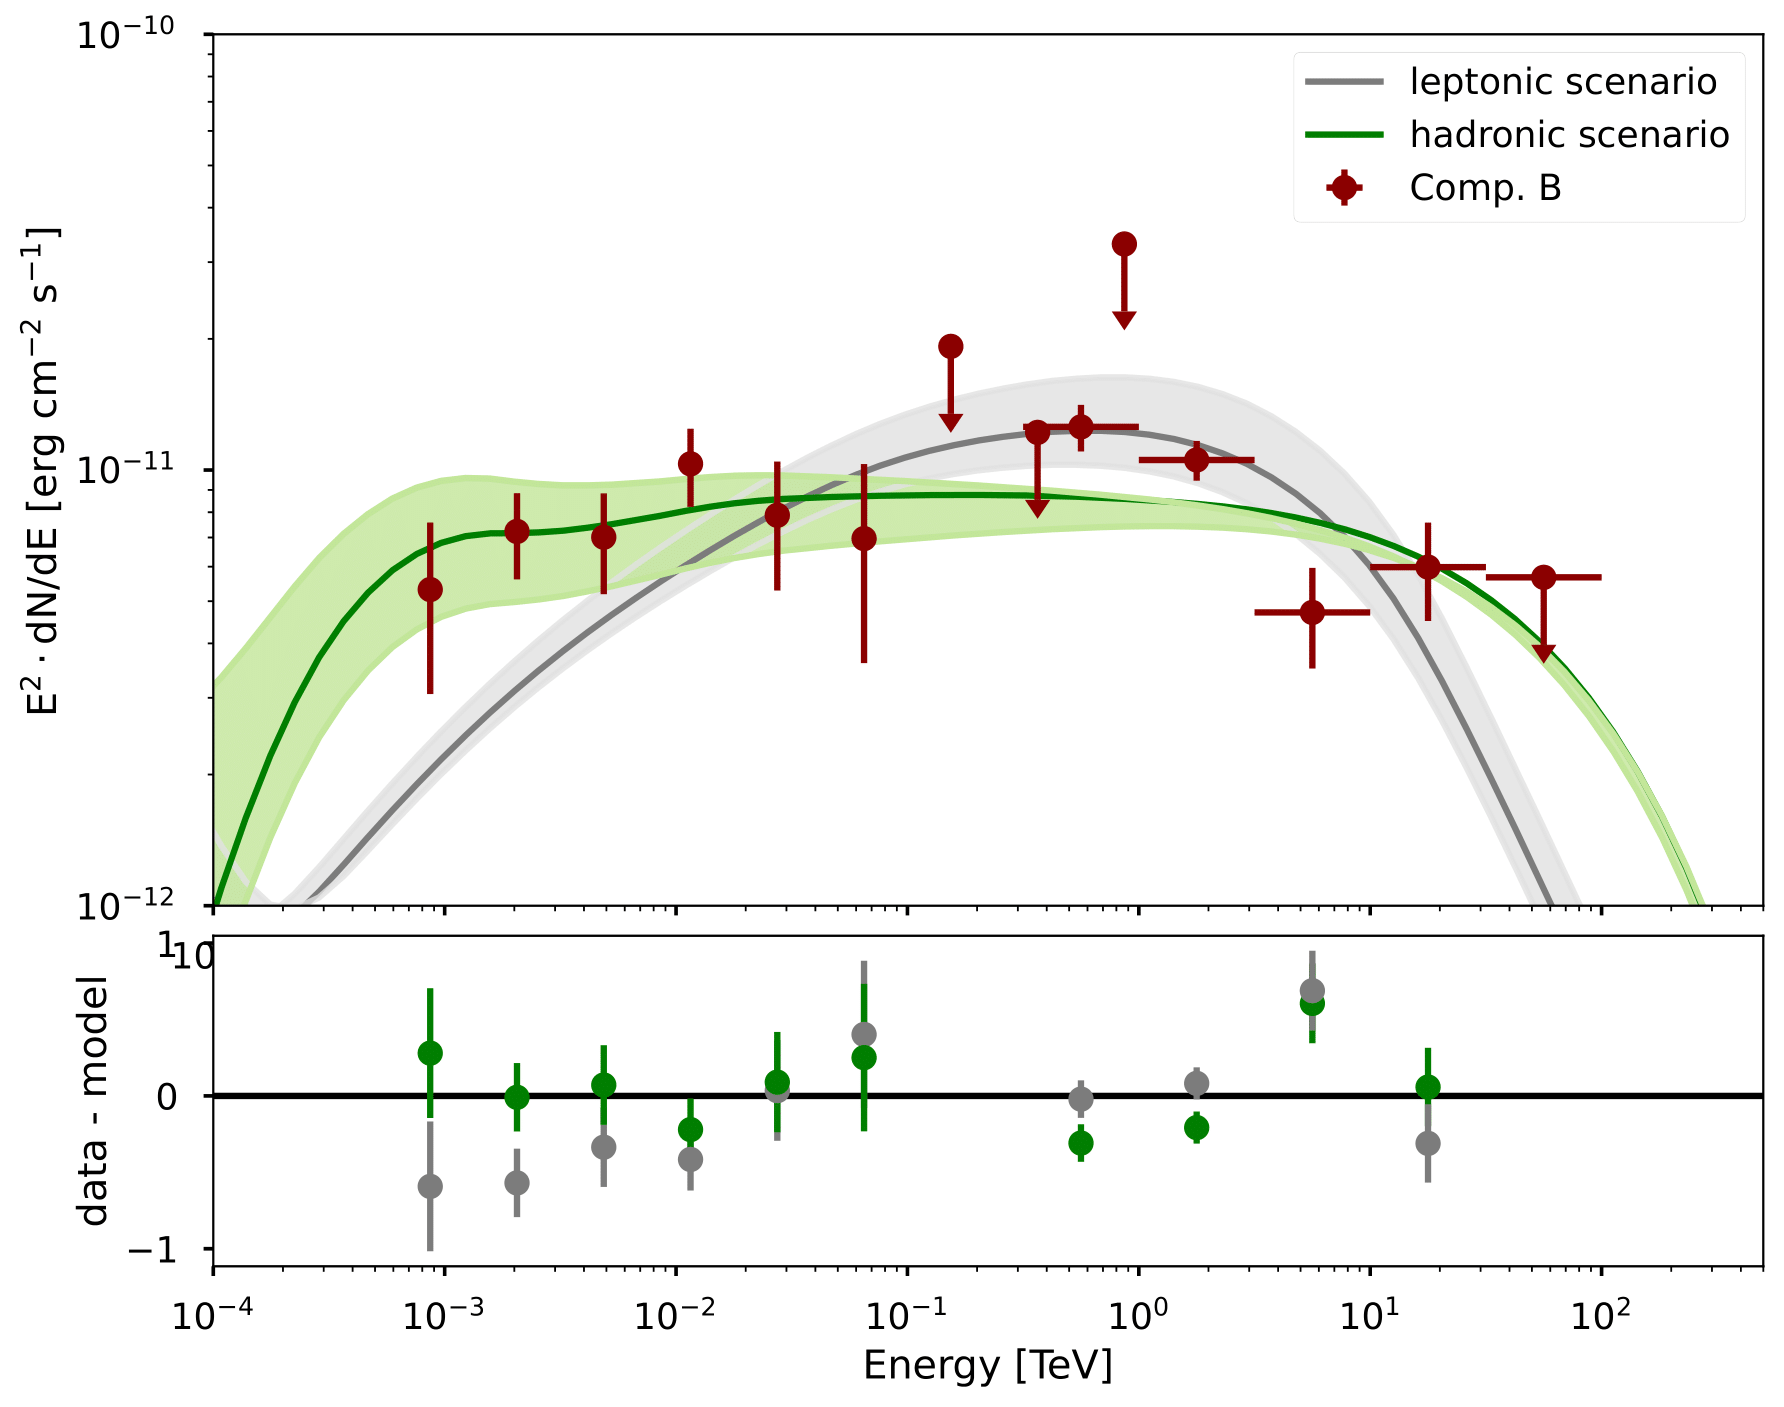
Figure 2:
SED derived from the analysis of the H.E.S.S. data:
[PDF]
Associated data files: [FITS (A)], [FITS (B)]
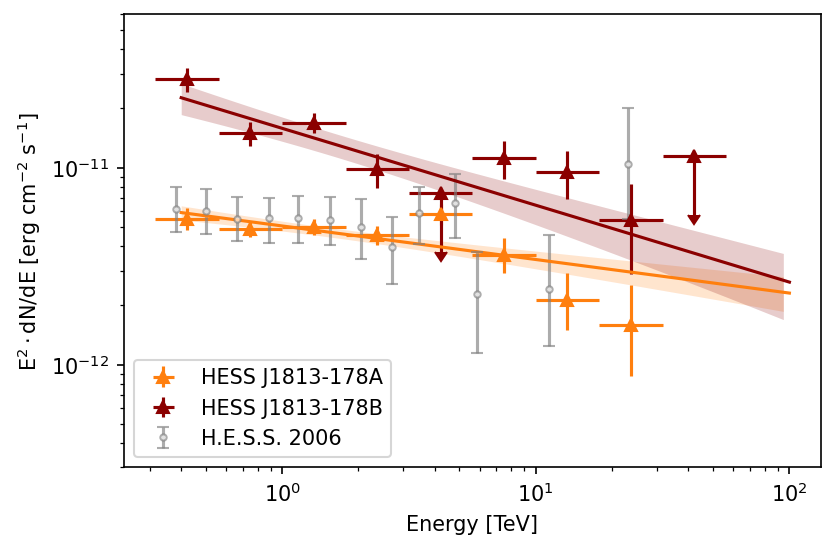
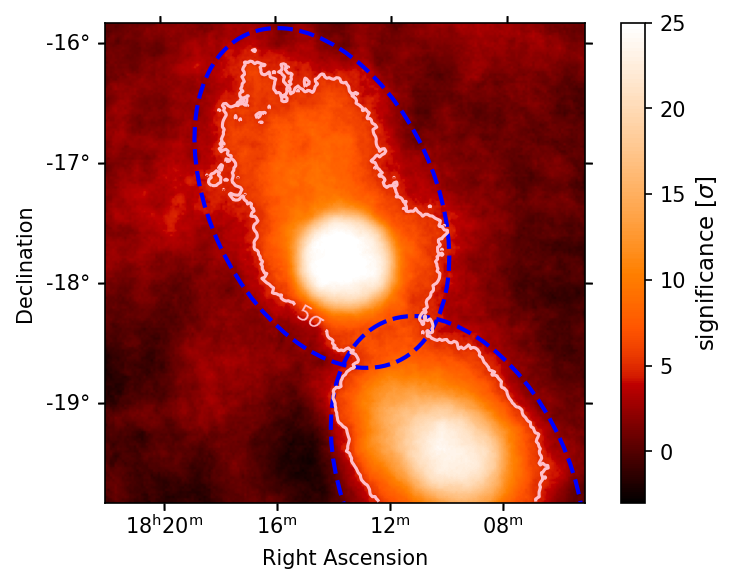
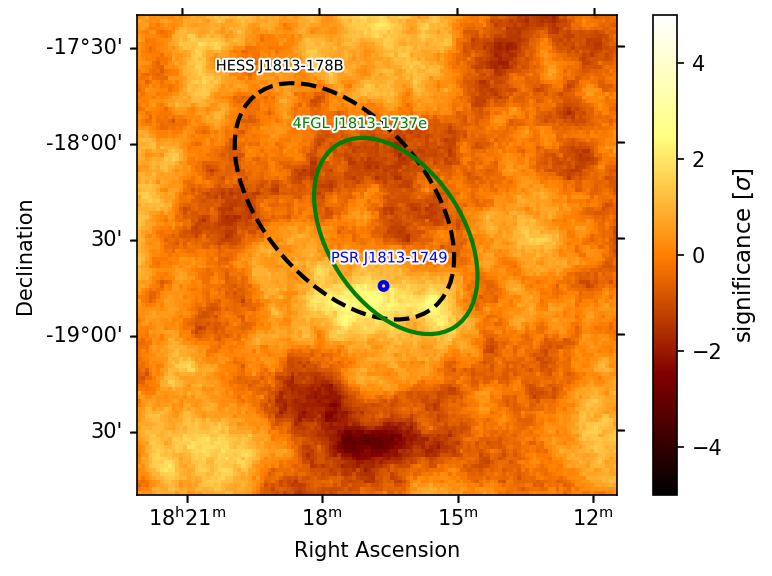
Figure 3:
Significance map:
 [PDF], [FITS]
Significance map after model fit:
 [PDF], [Model]
Figure 4:
SED derived from the analysis of the Fermi-LAT data:

[PDF]
Associated data files: [FITS (4FGL)], [FITS (C)]
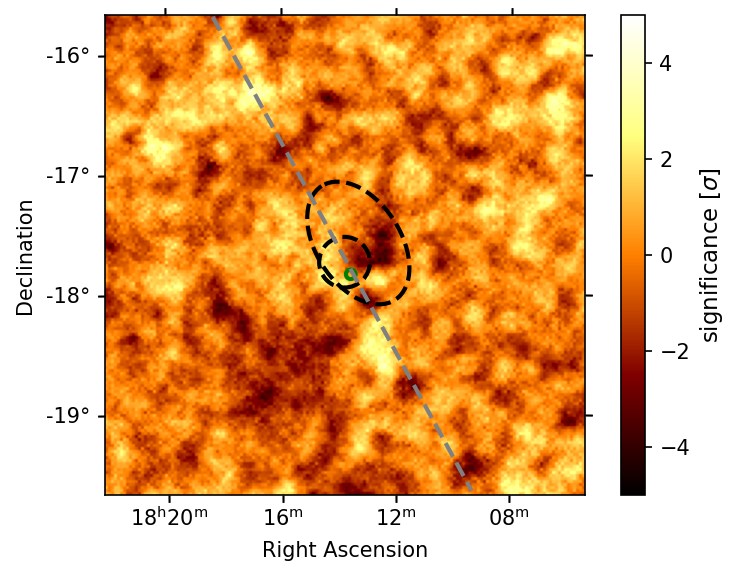
Figure 5:
Energy dependent morphology:
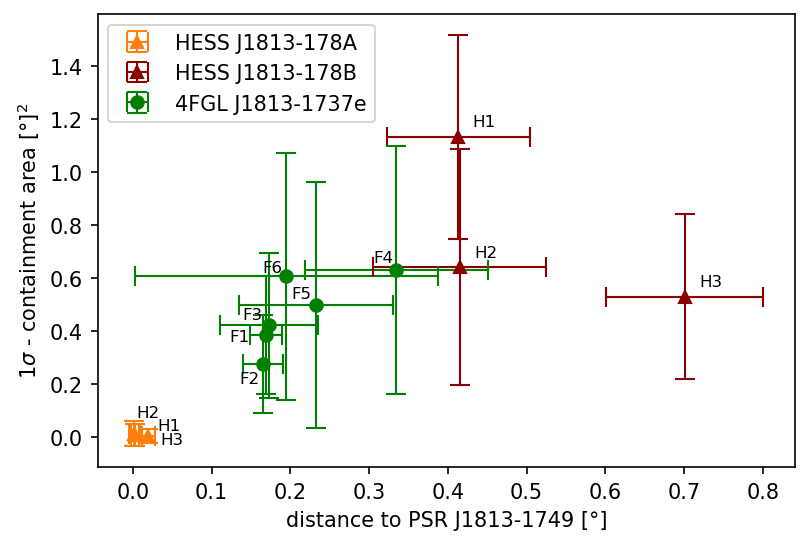
[PDF]
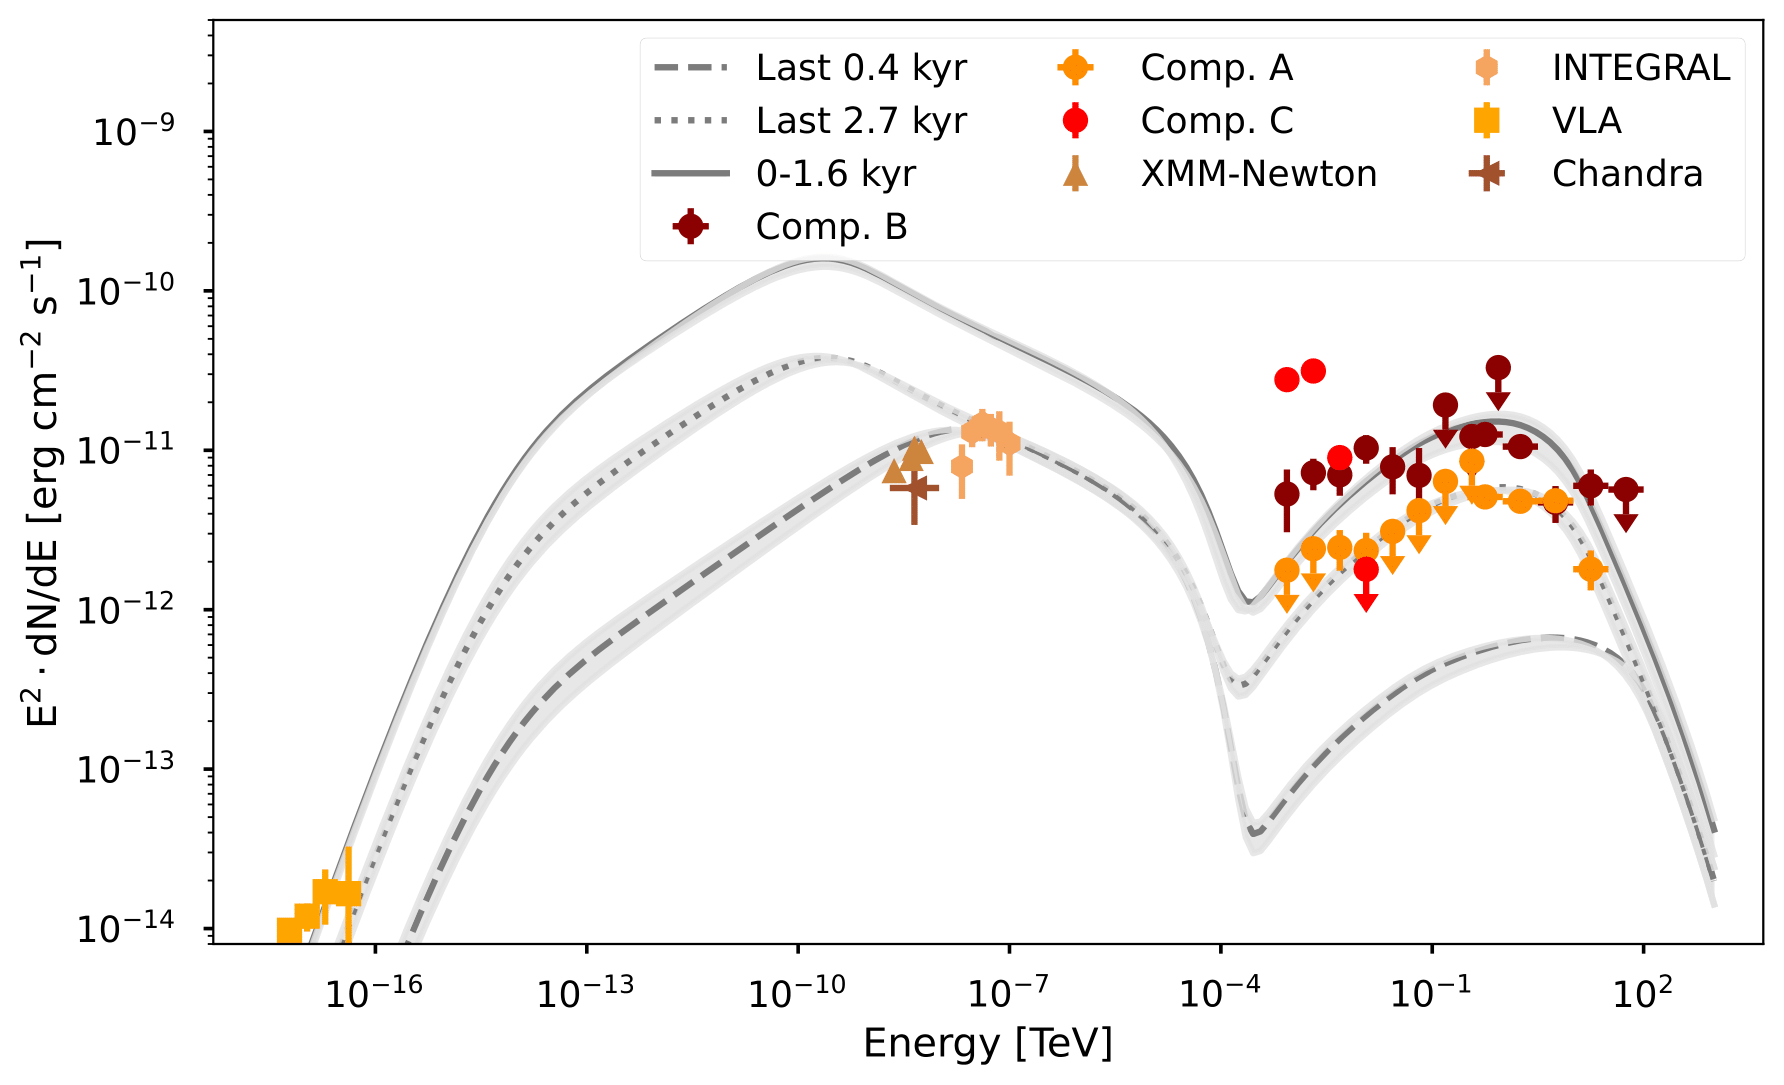
Figure 6:
SED derived from the joint fit:

[PDF]
SED Component A: [FITS (HESS)], [FITS (Fermi)]
SED Component B: [FITS (HESS)], [FITS (Fermi)]
SED Component C: [FITS]
Model parameter: [YAML (HESS)], [YAML (Fermi)]
Figure 7:
Spectral energy distribution for the leptonic model:
[PDF]
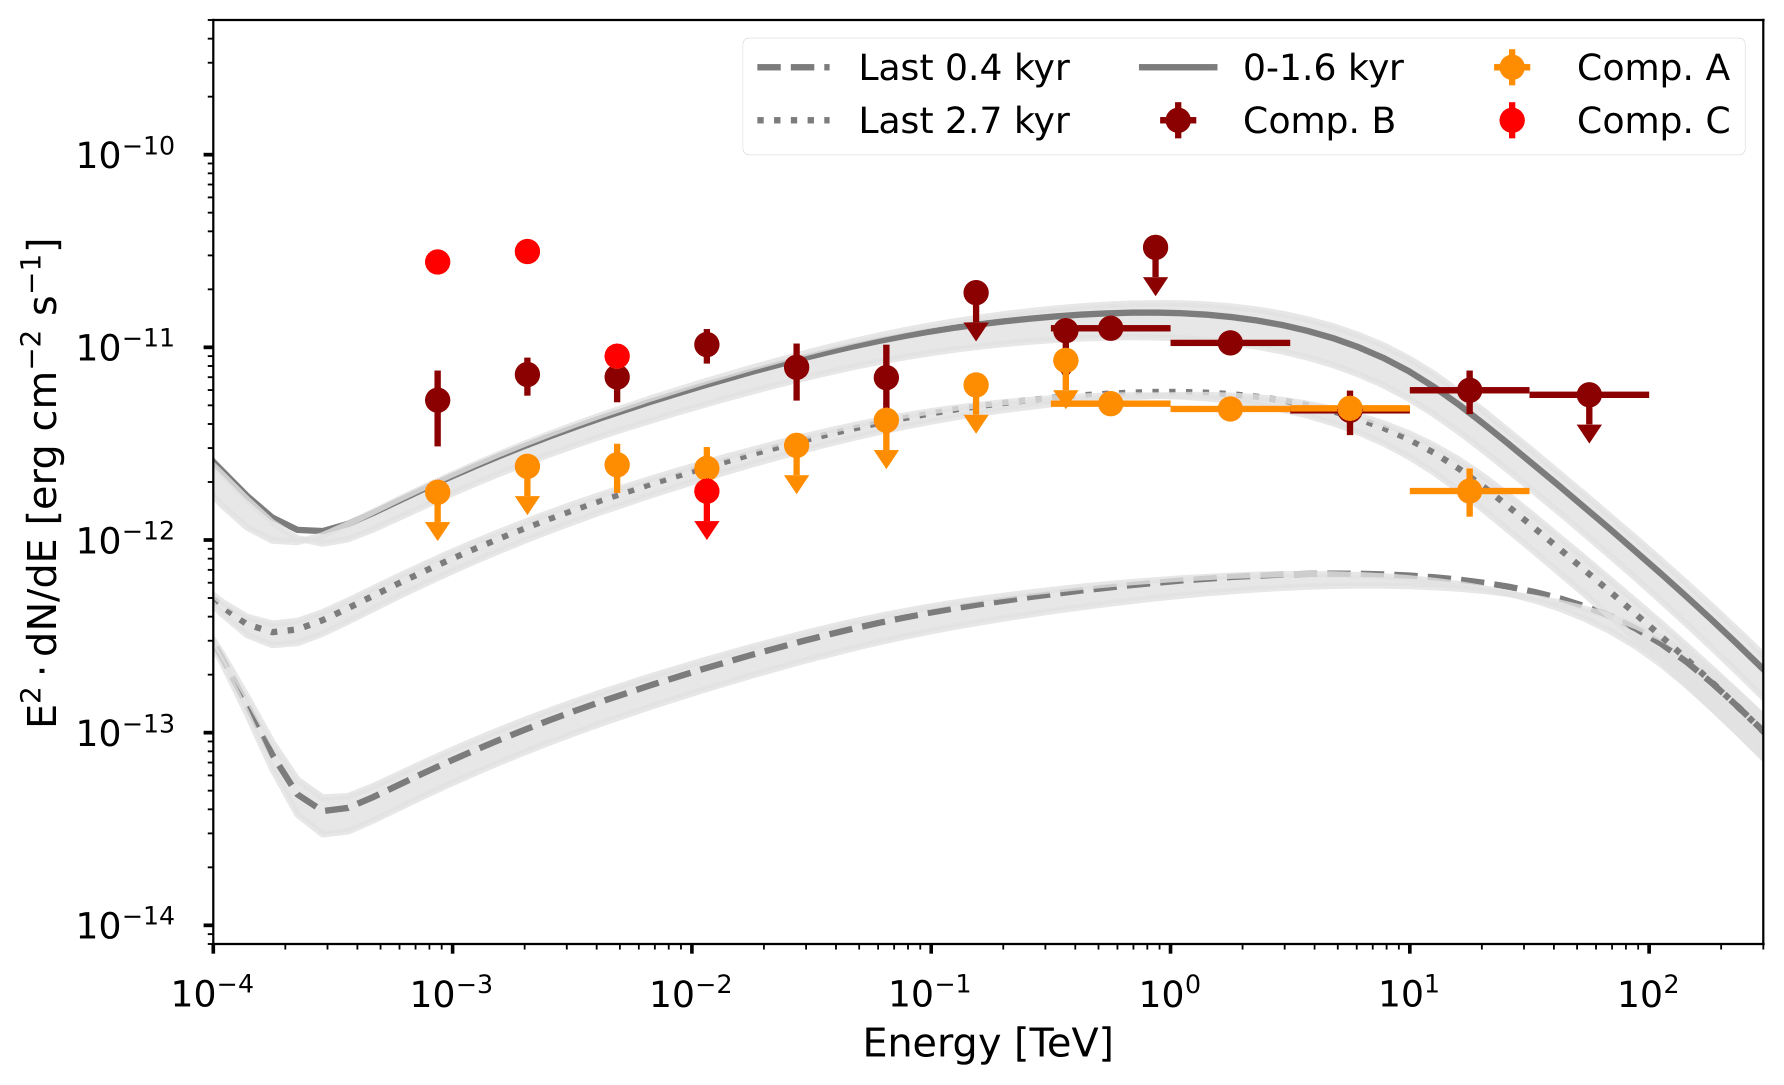
[PDF]
Figure 8:
Measured and predicted radius of HESS J1813-178B:
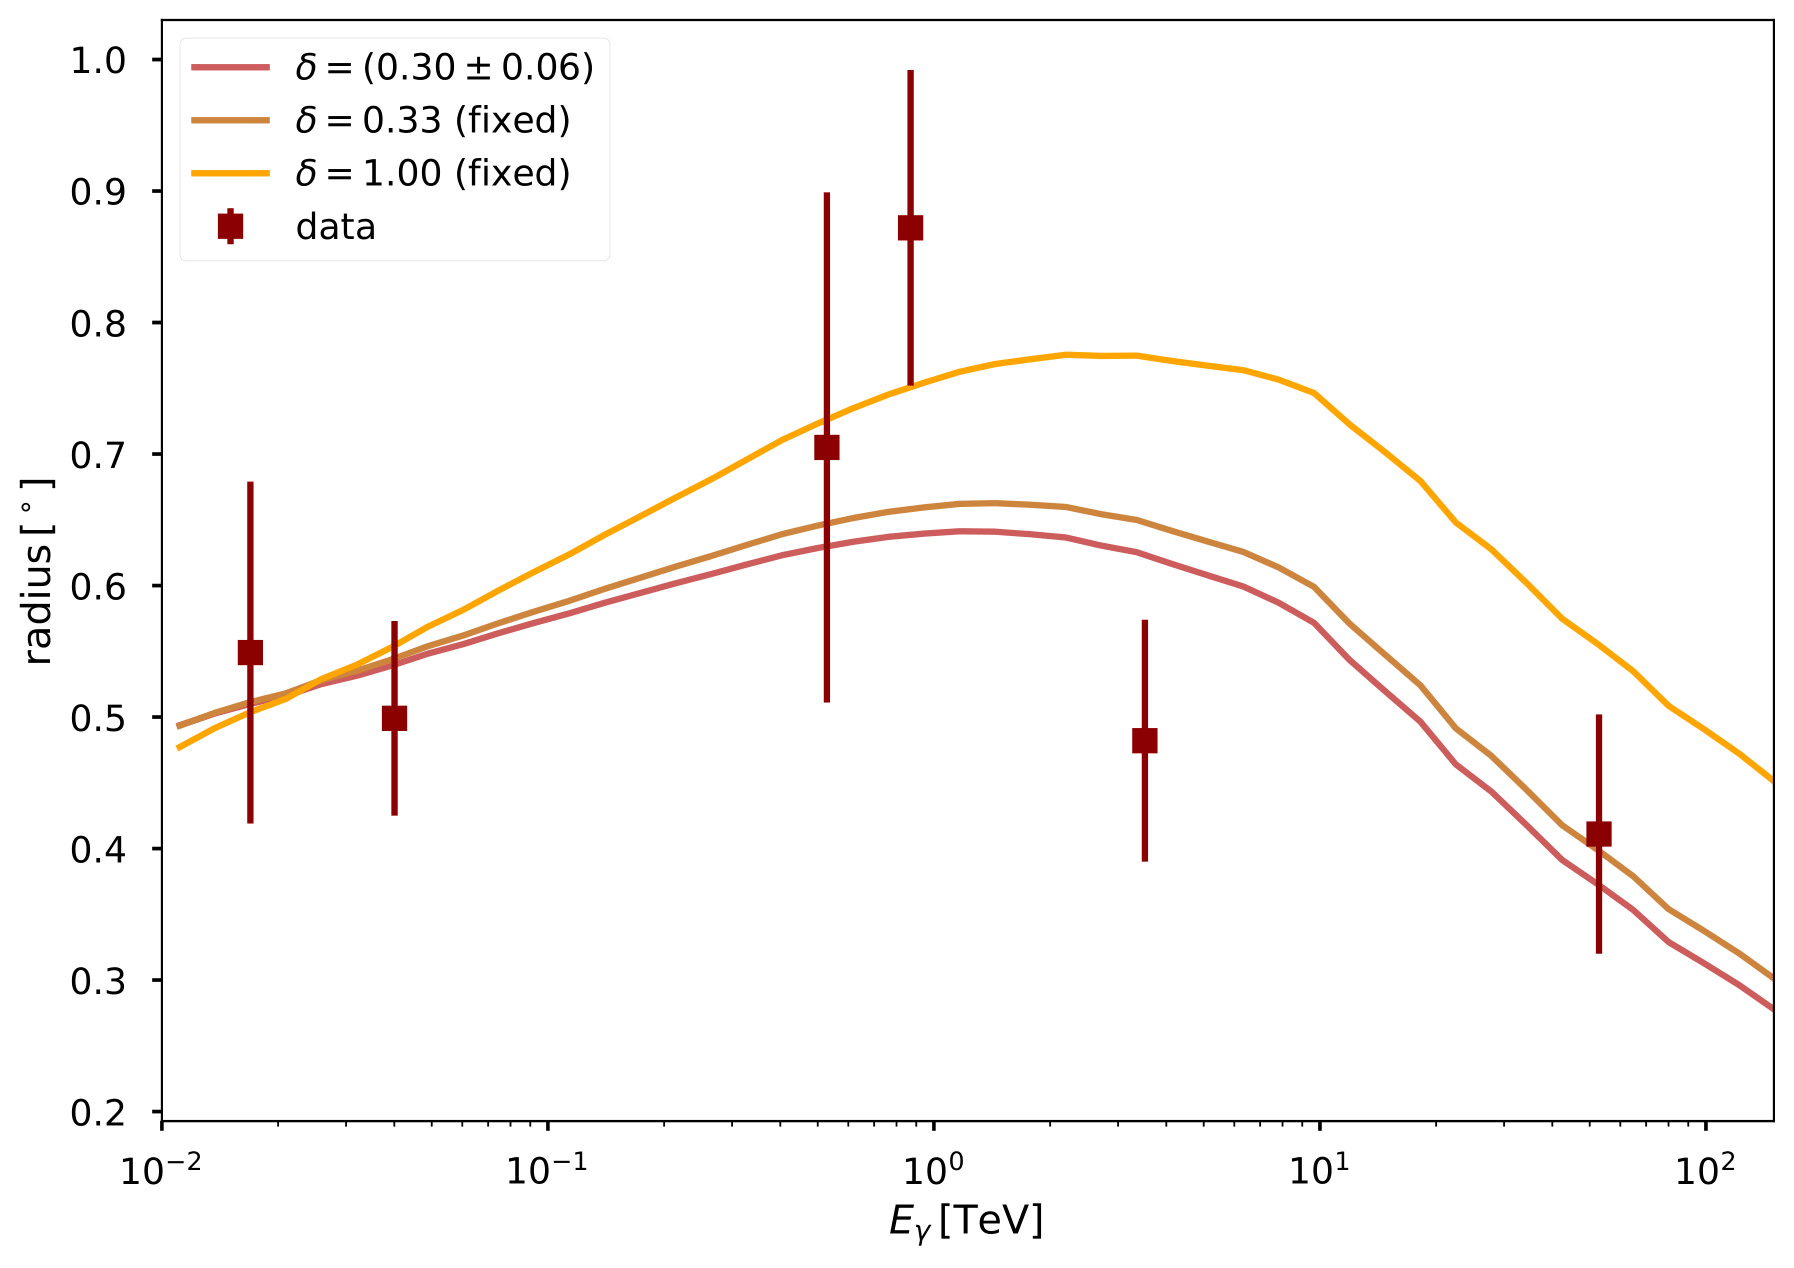
[PDF]
Figure 9:
Molecular clouds in the region:
[PDF]
Counts map of the H.E.S.S. data: [FITS]
Figure 10:
Energy loss time:
[PDF]
Figure A1:
Exclusion Region for the background fit
[PDF]
Figure A3:
Significance distribution of the emission outside of the exclusion regions
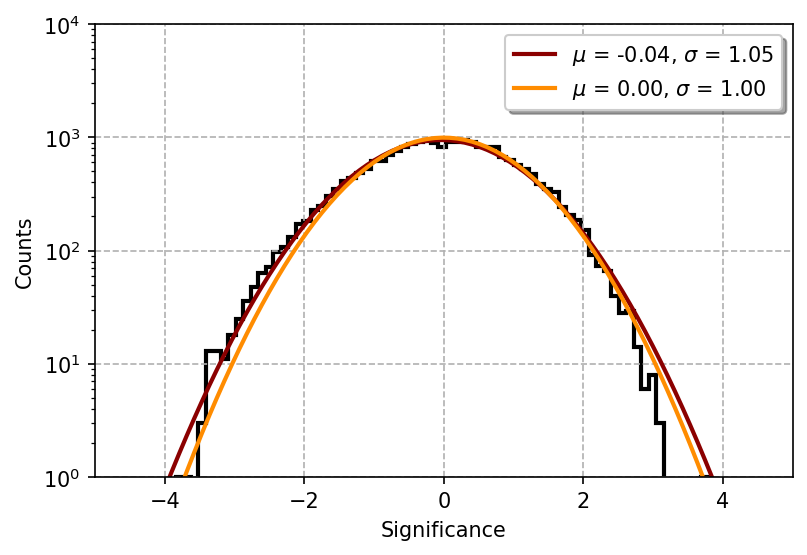
[PDF]
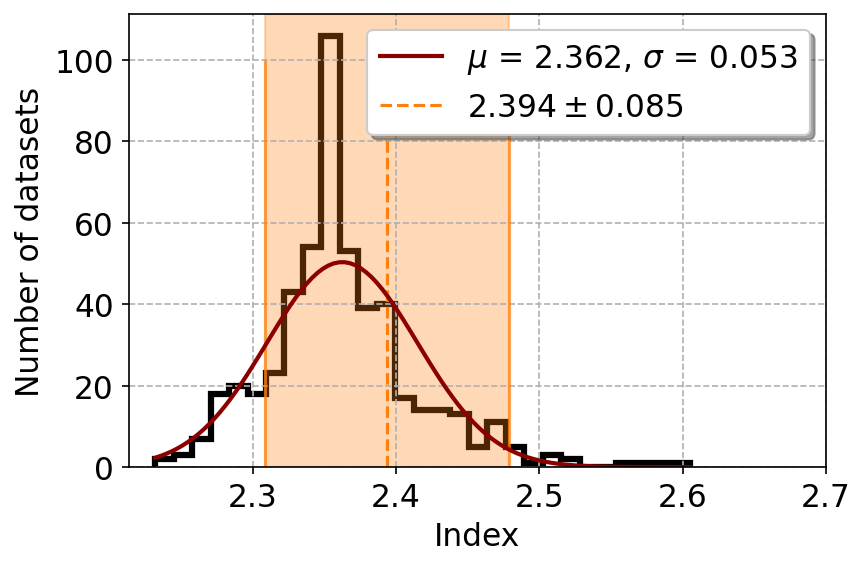
Figure B1:
Distribution of the best-fit values of the spectral index for HESS J1813-178B
[PDF]
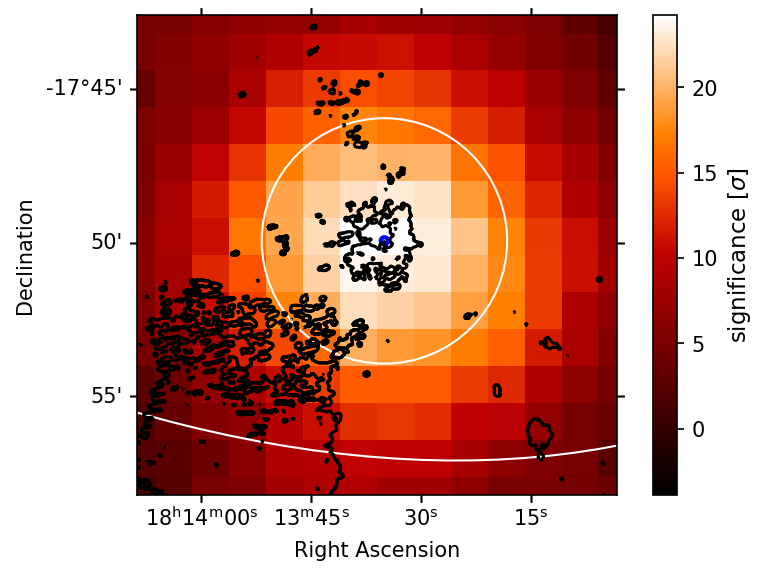
Figure C1:
Significance map of the emission seen by H.E.S.S. with an Correlation radius of 0.06 deg

[PDF]
Figure C2:
Exposure of the H.E.S.S. dataset

[PDF]
Figure E1:
Comparison of the best-fit models found in the analysis of H.E.S.S. and Fermi-LAT data
[PDF]
Figure E2:
Comparison of the gamma-ray emission with the position of the radio emission from G012.8-00.0
[PDF]
Figure E3:
Comparison of the best-fit position with the results obtained by HAWC and LHAASO

[PDF]
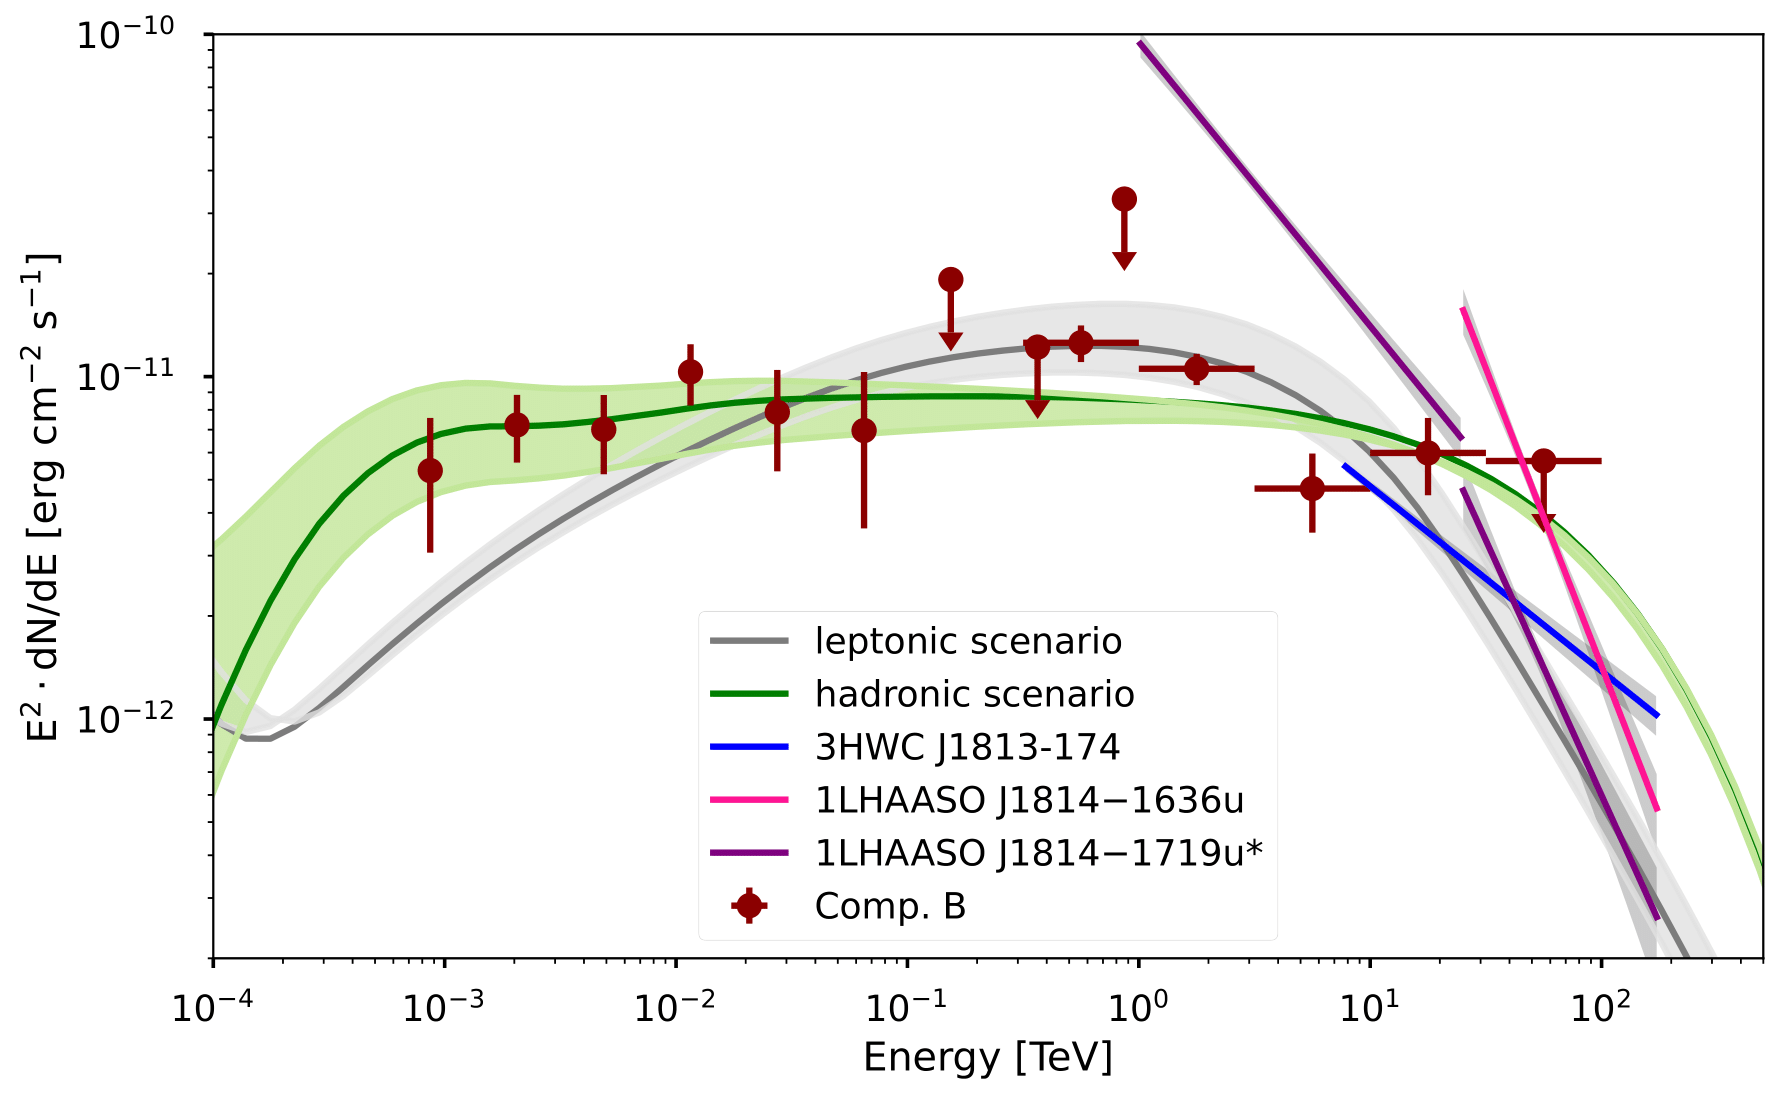
Figure E3:
Comparison of the SED for the leptonic and hadronic model to the spectra derived by LHAASO
[PDF]